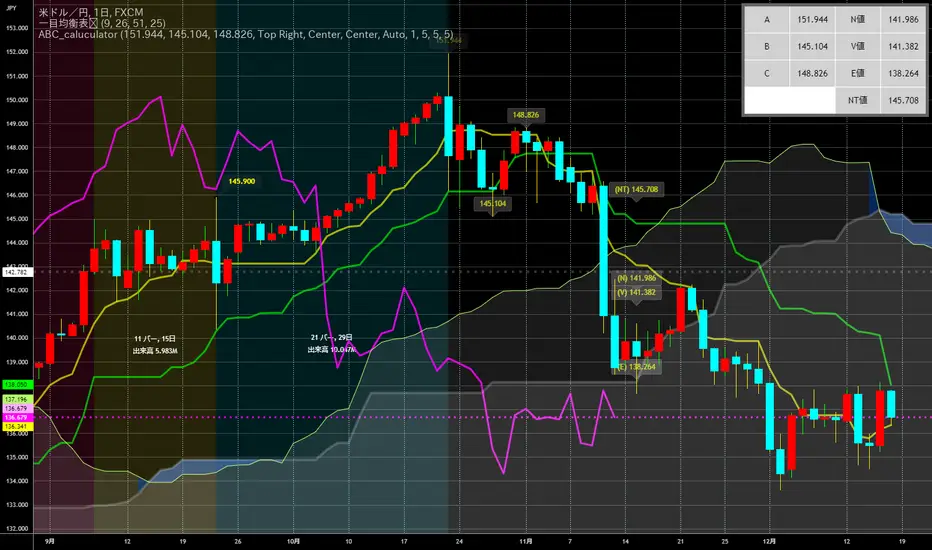
Goichi Hosoda TheoryGreetings to traders. I offer you an indicator for trading according to the Ichimoku Kinho Hyo trading system. This indicator determines possible time cycles of price reversal and expected asset price values based on the theory of waves and time cycles by Goichi Hosoda.
The indicator contains classic price levels N, V, E and NT, and is supplemented with intermediate levels V+E, V+N, N+NT and x2, x3, x4 for levels V and E, which are used in cases where the wave does not contain corrections and there is no possibility to update the impulse-corrective wave.
A function for counting bars from points A B and C has also been added.
Cerca negli script per "ichimoku"

Kojiro Dynamic Support|ResistanceGreetings to the community traders.
I offer you an addition to the Ichimoku Kinho Hyo indicator.
This indicator automatically draws dynamic resistance and support lines based on the theory of Mr. Kojiro.
The lines are drawn from the high and low you select to the Senkou Span A and B points from the highest time frame.
I hope this indicator will complement and improve your trading!
Please note that the basic value of the Kumo cloud line indent is 25 candles due to the specifics of the Trading View calculations.

SuperIchi [LuxAlgo]Using one indicator as the core for another one to improve certain aspects while offering an alternative user interaction can be very interesting in technical analysis.
This indicator is a modification of the popular Ichimoku indicator using the equally popular Supertrend indicator as its core, thus no longer entirely relying on calculations done over a fixed window size but instead relying on the average true range and the trend detection method offered by the Supertrend.
Settings
Tenkan: Atr length (left) and factor (right) used for the Supertrend involved in the calculations of the Tenkan Ichimoku component
Kijun: Atr length (left) and factor (right) used for the Supertrend involved in the calculations of the Kijun Ichimoku component
Senkou Span B: Atr length (left) and factor (right) used for the Supertrend involved in the calculations of the second Senkou Span Ichimoku component
Displacement: Bar offset of the cloud (positive offset) and Chikou (negative offset)
Usage
The SuperIchi indicator can be interpreted similarly to a regular Ichimoku as it retains the components and aspects from this one. Users can make use of the Supertrend Factor to detect shorter or longer-term trends.
Unlike the regular components of the Ichimoku based on rolling maximums/minimums, using the Supertrend here allows smoother components and makes it less prone to whipsaw signals.
Note that the Chikou is disabled by default in the style settings
Details
The original Ichimoku indicator is constructed from the average between the rolling maximum high and minimum low values. The Supertrend indicator also relies on one upper/lower extremity but using the average of these extremities for the modification of the Ichimoku indicator might not provide easy to use results due to the nature of these extremities.
Instead, we compute the average between the Supertrend and trailing maximums/minimums with a value reset when a new trend is detected by the Supertrend. This allows obtaining a result that is closer to the original average used by Ichimoku.

MokuMasterMokuMaster
MokuMaster is an advanced indicator built on Ichimoku Kinko Hyo.
Perhaps the most powerful function of Ichimoku charts is their depiction of trend conditions at a single glance. This is likely the original purpose of the technique, Ichimoku Kinko Hyo loosely translates to ‘one glance equilibrium chart’. When examining charts we use Ichimoku to determine directional bias. Should we be, 'Resolutely bullish', 'Bullish', 'Neutral', 'Bearish' or 'Resolutely Bearish'.
These categories are derived from the interactions between Price, the Tenkan-sen, the Kijun-sen, the Kumo and the Chikou Span. This can be overwhelming if you are not an accomplished Ichimoku trader.
MokuMaster allows you to view these interactions without the difficulty of interpreting what they mean. The definitions displayed below demonstrate how to use MokuMaster to determine directional bias.
Bright Green - Resolutely Bullish
Green - Bullish
Blue - Neutral
Pink - Bearish
Red - Resolutely Bearish
MokuMaster is designed to assist traders in establishing directional bias and not to replace traditional entry and exit techniques. We recommend using it in conjunction with TrendMaster for best results.
Our Story
Founded in 2018 by IchimokuScholar and C00kie, TrendMaster is a team that produces technical analysis indicators with an emphasis on simplicity and noise reduction. We support a large community with educational content, automated market scanners and mentoring in our private chat rooms. We produce technical analysis indicators geared primarily towards the emerging Cryptocurrency asset class. We provide educational material to assist trader development and host a large online trend following community. All of our products are designed to help traders distinguish relevant information from background noise. Our indicators encourage disciplined trade management to maximise the opportunity captured while minimising losses.
IchimokuScholar
IchimokuScholar – In 2017 I retired from a career in higher education to focus on Trading. I like to trade long term trends, focusing primarily on continuation setups. I am dedicated to sharing my knowledge of trading and take great pleasure in simplifying technical analysis for newer traders.
C00kie
I started trading crypto in 2017 and immediately started coding a bunch of tools to improve my quality of life. Some definitely worked out better than others. Like to trade the higher timeframes and drawing horizontal lines on charts. I am also pretty much obligated to like cookies.

TENKAN SCALPER STRATEGYTENKAN SCALP is a fully automatic trading system.
It is a continuation of our previous ichimoku release. This time however we throw out the rule book and use ICHIMOKU in a very different way.
It applies non traditional money management tactics.
While most trading strategies rely on a stop loss and a take profit target to manage risk. This strategy uses either no stop loss at all or a time based stop loss.
You might ask yourself the question why would you keep a trade open if it goes against you? Here are a phew reasons why the script does what it does.
Forex Markets consolidate most of the time. If you wait long enough your Take Profit will get hit anyways most of the time
You don't have to risk everything per trade. I keep my orders small so to keep some powder to get into some more trades
All the extra trades you take while one trade is in drawdown limit the drawdown as they provide cashflow
On lower timeframes the markets are so chaotic that a stop loss is very likely to get hit by a wick
About backtest below
This backtest uses a spread of 2 pips for entries and a default position size of 100% of equity. This is only possible on exchanges where spread is low and you have 10:1 leverage or more. It does not represent results obtainable without leverage. Do take into account that there are a lot of forex exchanges that provide this leverage, however a 2 pip spread is not always guaranteed and only applies to major pairs.
This backtest does not use the TIME BASED STOPS functionality.
Always start with small position sizing and see how the strategy performs before adding risk.
Explanation of variables:
Chikou(lagging span): pink line, this is price plotted 26 bars ago. People ignore the power of this it is crucial to see how chikou behaves towards past price action as seen in the chart below where we got an entry at red arrow because chikou bounced from past fractal bottom.
Kijun-Sen(base line): Black line or color coded line. This is the equilibrium of last 26 candles. To me this is the most important line in the system as it attracts price.
Kijun = (Highest high of 26 periods + Lowest low of 26 periods) ÷ 2
Tenkan-Sen(conversion line): Blue line. This is the equilibrium of last 9 candles. In a strong uptrend price stays above this line.
Tenkan = (Highest high of 9 periods + Lowest low of 9 periods) ÷ 2
Senkou A (Leading span A)= Pink cloud line, this is the average of the 2 components projected 26 bars in the future.
Senkou A = (Tenkan + Kijun) ÷ 2
Senkou B (Leading span B) = Green cloud line, this is the 52 day equilibrium projected 26 bars in the future.
Senkou B = (Highest high of prior 52 periods + Lowest low of prior 52 periods) ÷ 2
projection: Script uses same function for variable calculation and substracts a number on each next bar as to make a projection of where the variable will be in future bars if price stayed the same. This works as ICHIMOKU calculations use the middle point of a past set of data. The shorter that amount of bars will be in line with the data that it will be restricted to in future if price stayed the same.
Detection of Market Environment
To enter trades the script uses a lot of ICHIMOKU concepts. Contrary to how most people trade ICHIMOKU this script takes an environment that ICHIMOKU identifies as trending upwards and shorts in that environment. The same will be applied to a downtrend where it will open LONGS.
List of CRITERIA for a trend:
Grapling Hook: this is a component based on the chikou span (closing price displaced 26 bars into the past). The script will use an ATR based range to define a possible future projection to the CHIKOU line. For a market to be bullish there should be no price action happening within this area. Market is free to move upwards. Vice versa for bearish .
Kumo Cloud: script will check if price is above the cloud for bullish trend and below cloud for bearish trend .
Chikou above Kijun: script will check if the chikou line is above the KIJUN line of 26 bars ago. This is further confirmation that price is trending high enough compared to it's past data. Vice versa for downtrend.
Kijun projection: script will check if past Kijun is lower than future projected Kijun. This to ensure we get an equilibrium in our favour in the future. Vice versa for downtrend
Tenkan projection: script will check if future Tenkan-sen will be higher than Kijun-sen for an uptrend. Vice versa for downtrend.
Cloud projection: script will check if in 9 bars the Senkou Span A will be higher than Senkou Span B for an uptrend. Vice versa for downtrend.
Example:
This script does not visualise the prediction lines like I show in the example. I show them here to clarify how the script works.
Usage
Backtests are not indicative of future results, although a trader may want to use a strategy script to have a deeper understanding of how their strategy responds to varying market conditions, or as a tool for identifying possible flaws for a strategy that may be indicative of good or bad performance in the future.
Strategy Settings:
Minimum Body Size (atr): this is the minimum ATR a signal bar needs to be for entry. This is useful because our TP is based on previous bar.
Lot size per trade: this setting does not impact backtest. It is used to for the signals to let tradingconnect.com know your position size.
Direction: do you want to trade longs or shorts. I personally use both a long bot and a short bot at the same time.
Positions Allowed: the amount of positions the script will keep open as a maximum. You do not want to open too many positions, this is for risk management.
Close all positions at drawdown: if total open positions loss gets to this % target it will close all positions.
MetaTrader Prefix: when the script sends a signal it will put this text right before the symbol name from syminfo.ticker
MetaTrader Suffix: when the script sends a signal it will put this text right after the symbol name from syminfo.ticker
Charts below are some examples on how the script handles orders on default settings:
without time based SL
with time based SL
how it handles pyramiding
www.tradingview.com
Tradingconnector.com:
For full automation of the forex market the script uses this connector to execute trade on MT4. The alerts the script sends using the alerts() function call are structured in a way tradingconnector will recognise and send directly to MT4. You can find documentation about this tool on their own website.
Personal recommendation is to start with a minimum lot size and track performance, if you are comfortable scale the size up. You can do that by increasing the lot size setting in the script and making a new alert. Make sure to delete the old one.
How to access
You can see the Author's Instructions below to visit our telegram to get more information on how to get access.

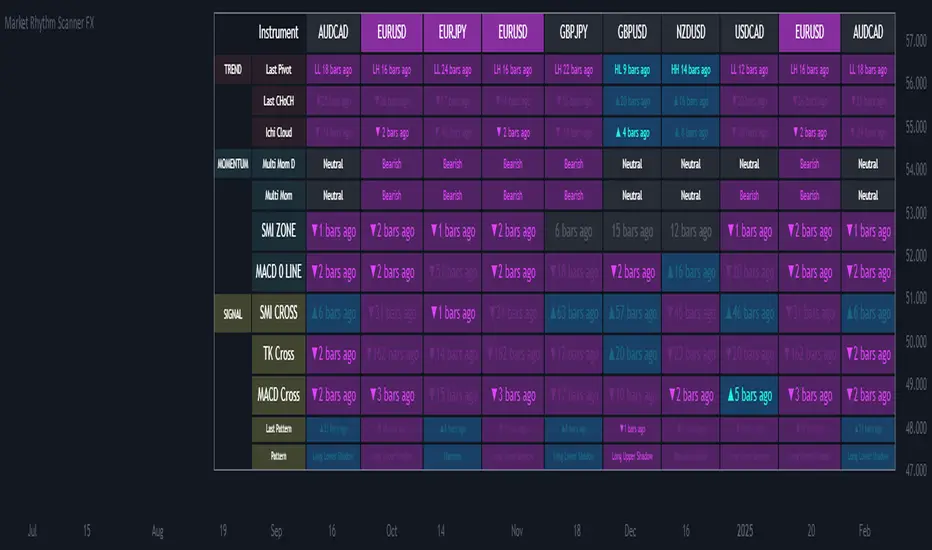
Ultimate Market Rhythm Scanner FXReady to feel like a chart-wielding wizard? The Ultimate Market Rhythm Scanner FX is here to supercharge your Forex analysis by piping in multi-timeframe goodness from up to 10 OANDA currency pairs. You’ll see structure breakouts, Ichimoku signals, MACD pulses, RSI/Bollinger momentum waves, and candlestick patterns—all at once.
Think of it as your own personal mission control dashboard, scanning the FX galaxy and beaming back color-coded signals so you know instantly where the market action is hottest. Remember, to keep the data aligned, you’ll want to load this indicator on an OANDA FX pair chart (like OANDA:EURUSD) so everything lines up perfectly behind the scenes.
Key Features
Market Structure Wizardry
Locates pivot highs and lows (Higher High, Lower Low, etc.)
Spots breakouts above/below these pivots
Shouts out “CHoCH” (Change of Character) when structure flips from bullish to bearish (or vice versa)
If you want to understnd more about the market structure logic in this script check out my other script, it uses the same logic:
Tracks price above/below the Ichimoku Cloud
Flags Tenkan/Kijun crosses for bullish or bearish setups
MACD & SMI Insights
MACD line vs. Signal Cross & crossing the Zero line
SMI crosses in overbought/oversold “zones” (because pure oscillator mania is cool)
Momentum Radar
Mashes up RSI + Bollinger + Ichimoku for either “Bullish,” “Bearish,” or “Neutral”
Also checks a separate Daily timeframe for cosmic perspective
Candlestick Pattern Goodness
Detects common candle formations (Hammer, Hanging Man, Marubozu, etc.)
Tells you exactly how many bars ago they flashed their signals
Time Fade Magic
Recent signals shine bright
Older signals fade out like invisible ninjas after a user-defined number of bars
Explanation of Settings
Below lies the control panel for your new chart-snooping sidekick:
Symbol Settings (Symbol 1...Symbol 10)
Select multiple FX OANDA pairs (like OANDA:AUDUSD).
Each pair spawns a new column in the scanner table.
Ensure your chart is also set to an OANDA pair—the script only speaks “OANDA.”
Ichimoku Settings
Use Ichimoku Filter: Toggles everything Ichimoku.
conversionPeriods, basePeriods, laggingSpan2Periods, displacement: The classic Ichimoku parameters to mold your cloud magic.
Pivot Logic
Pivot Source: Wicks vs. Closes for pivot detection.
BOS Confirmation: If you prefer breakouts confirmed by wicks or closes.
Left Swing Length: Bars left for pivots.
Right Swing Length High / Low: Bars right for pivot confirmation.
Invert Right Swing in Bearish Trend: Auto-flip logic when gloom takes over. This means right swing size high value will become right swing size low value in a bearish trend (determined by latest CHoCH).
RSI & Bollinger
RSI Period: The heartbeat of RSI.
RSI Overbought / Oversold: Thresholds for RSI mania.
BB Length / StdDev: The Bollinger band radius for measuring price expansions.
MACD
fastLength, slowLength, signalLength: The trifecta that shapes your MACD wave.
SMI Settings
Nested variables for SMI’s K, D, and EMA lengths.
Overbought and Oversold levels for zone detection.
Time Display Settings
Fade out old signals: Turn the fade effect on/off.
Fade After X Bars: The number of bars after which signals do a ghost trick.
Fade Transparency: How ghostly (0–100) those old signals become.
Table Settings
Show Table: Summon or banish the entire scanner table.
Table Position: Choose the quadrant for your new data-loving sidekick.
Table Text Size: Big or small text for those crucial signals.
Table Layout
With “Show Table” on, a futuristic readout appears, listing:
Columns: Each symbol’s name runs across the top (up to 10).
Rows: A row for each technical aspect, such as:
Last Pivot (pivot) – The most recent pivot type (HH, HL, LH, LL) and how many bars ago.
Last CHoCH – Crows “▲/▼ X bars ago” if structure reversed.
Ichi Cloud (ichi) – Tells you if price soared above or dived below the Cloud.
Multi Mom D (momentum_d) – A daily momentum label (Bullish/Bearish/Neutral). It shows you daily momentum even on times frames lower than the daily. Multi Mom D is not reliable if the chart is on a time frame higher than the daily.
Multi Mom (momentum) – Current timeframe momentum label.
SMI ZONE (smizone) – If SMI’s in a bullish or bearish zone.
MACD 0 LINE (macdzero) – Number of bars since crossing zero.
SMI CROSS (smicross) – A bullish or bearish cross in overbought/oversold territory.
TK Cross (tk) – Tenkan/Kijun cross and how many bars ago.
MACD Cross (macd) – MACD crossing above/below its signal line.
Last Pattern (lastpat) – The candle pattern found and bars since it popped.
Pattern (pattype) – The name of that pattern (Hammer, Hanging Man, etc.).
Each cell can be tinted in a blue-ish glow for bullish vibes, or a purple shade for bearish signals. The “bars ago” text helps you see how fresh the signal is—fewer bars = more relevant.
Usage Notes
OANDA Chart is King
Always apply this indicator on an OANDA-based chart (e.g., OANDA:GBPJPY). If you deviate, the script might not retrieve data properly from the OANDA feed.
Symbol List
For each of the symbols inputs, pick your favorite currency crosses (all from the OANDA universe).
Timeframes
The script runs on your current chart’s timeframe for near-term action.
It simultaneously checks the daily timeframe to measure high-level momentum.
Fade-Out Feature
By default, signals older than 5 bars fade out. Adjust in “Time Display Settings” if you want them to linger.
Confluence is King
If a pivot breakout, bullish Ichimoku cross, and an SMI overbought cross all light up at once, you might have a short-term rocket on your hands. Always confirm with your trading plan!
Summary
Embrace your inner data nerd with the Market Rhythm Scanner FX—the ultimate multi-asset intelligence platform for OANDA Forex pairs. From subtle pivot changes to daily momentum shifts, from candle patterns to MACD fireworks, it’s all consolidated into one easy-to-digest control panel.
Step 1: Load up an OANDA chart (like “OANDA:EURUSD”).
Step 2: Enter your chosen OANDA pairs under “Symbol Settings.”
Step 3: Geek out over the instant real-time multi-indicator table, letting you see which instruments are sizzling or fizzling.
No more frantic tab-hopping. Save your mental bandwidth for the big decisions.
Let the Ultimate Market Rhythm Scanner FX be your ever-watchful sidekick, scanning the charts so you can conquer the Forex battlefield like the tech-savvy champion you are!
This script is free to use at present, but I reserve the right to move it behind a paywall in the future.
lib_hlmLibrary "lib_hlm"
Ichimoku trend line and plotting tools.
HLM(Period)
Optionless Ichimoku/Donchian trend line calculation.
Parameters:
Period : The period for the trend line calculation.
Returns: The midpoint of the highest high and the lowest low.
HLM_Offset(offset, currentIsZero, intoPast)
Standardized language for plotting offsets.
Parameters:
offset : The offset number to use.
currentIsZero : `true` for ichimoku counting. `false` for natural language
intoPast : `true` if projecting backwards. `false` if projecting forwards.
Returns: The offset adjusted by counting style and direction.
TK()
Calculates the Ichimoku Tenkan and Kijun lines.
Returns: {tenkan, kijun}
SenkouSpans(period_1, period_2, period_3)
Calculates the Ichimoku Senkou Span A and Senkou Span B values.
Parameters:
period_1 : default=9
period_2 : default=26
period_3 : default=52
Returns: {senkou_a, senkou_b}
Ichimoku_Cloud(period_1, period_2, period_3)
Calculate the Ichimoku cloud value and offsets.
Parameters:
period_1 : default=9
period_2 : default=26
period_3 : default=52
Returns: {senkou_a, senkou_b, cloud_offset}
Chikou_Span()
Gets the chikou span and offsets.
Returns: {chikou, chikou_offset}
Ichimoku(enabled)
Get the values for the full, default Ichimoku system, including plotting offsets. Common toggle for all values.
Parameters:
enabled : `true` will return plottable values. `false` will return only na's (turns off plotting).
Returns: {tenkan, kijun, senkou_a, senkou_b, cloud_offset, chikou, chikou_offset}
Ichimoku_Line_Colors()
Get a set of colors with a common transparency for Ichimoku.
Returns: {tenkan_color, kijun_color, senkou_a_color, senkou_b_color, chikou_color}
Ichimoku_Cloud_Color()
Determines the cloud color and applies transparency (Ichimoku).
Returns: the dominant lines color with applied transparency
Ichimoku_Colors()
Gets a full set of default ichimoku colors with cloud color based on the input senkou values.
Returns: {tenkan_color, kijun_color, senkou_a_color, senkou_b_color, chikou_color, cloud_color}
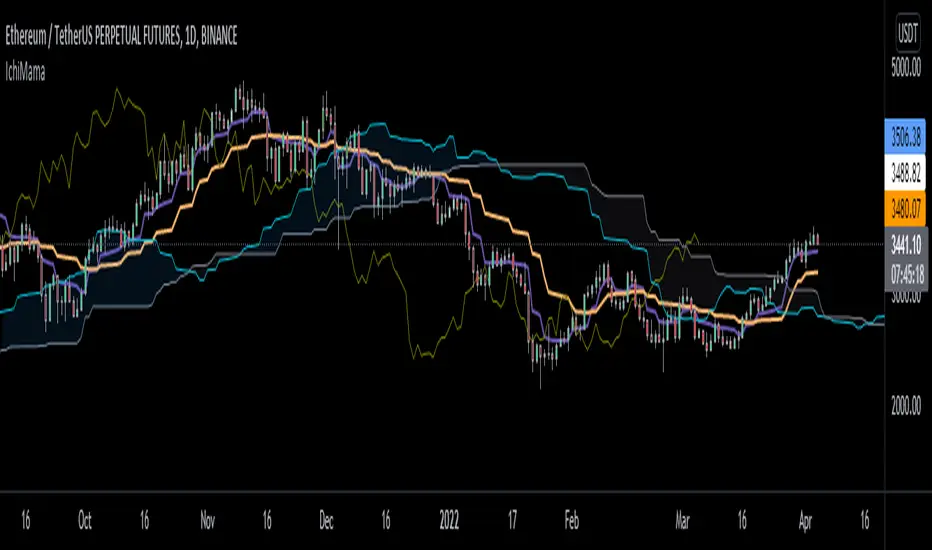
IchiMAMA (Experimental)Goichi Hosoda's "Ichimoku Kinkō Hyō" is a widely used Trend Following indicator and can be defined as a "system" rather than an indicator.
Published in the late 1960's, consisting of 5 lines.
TenkanSen (Conversion Line) = of the last 9 bars
KijunSen (Base Line) = of the last 26 bars
SenkouSpanA (Leading Span A) = Average of Tenkan&KijunSen shifted -> 26 bars
SenkouSpanB (Leading Span B) = of the last 52 bars
ChikouSpan (Lagging Span) = Price shifted <- 26 bars
On the other hand, Mesa Adaptive Moving Average developed by John Ehlers around early 2000's shows similarities with Hosoda's Tenkan and KijunSen using a different calculation method. For futher info: www.mesasoftware.com
I find MAMA superior to TenkanSen and KijunSen in terms of crossing signals.
Ichimoku:
Thus, decided to replace TenkanSen and KijunSen of regular Ichimoku with MAMA&FAMA of Ehlers and calculated SenkouSpanA accordingly. SenkouSpanB and ChikouSpan stays the same as per Ichimoku's logic. (Periods are 30 by default for cryptocurrencies. If stocks then 26)
IchiMAMA:
This is purely experimental and educational. Hope you'll like it :)
I'd like to thank @everget for MAMA&FAMA
and @KivancOzbilgic for Ichimoku Kinkō Hyō and Volume Based Colored Bars
ChikouLibrary "Chikou"
This library contains Chikou Filter function to enhances functionality of Chikou-Span from Ichimoku Cloud using a simple trend filter.
Chikou is basically close value of ticker offset to close and it is a good for indicating if close value has crossed potential Support/Resistance zone from past. Chikou is usually used with 26 period.
Chikou filter uses a lookback length calculated from provided lookback percentage and checks if trend was bullish or bearish within that lookback period.
Bullish : Trend is bullish if Chikou span is above high values of all candles within defined lookback period. Bull color shows bullish trend .
Bearish : Trend is bearish if Chikou span is below low values of all candles within defined lookback period. This is indicated by Bearish color.
Reversal / Choppiness : Reversal color indicates that Chikou are swinging around candles within defined lookback period which is an indication of consolidation or trend reversal.
chikou(src, len, perc, _high, _low, bull_col, bear_col, r_col) Chikou Filter for Ichimoku Cloud with Color and Signal Output
Parameters:
src : Price Source (better to use (OHLC4+high+low/3 instead of default close value)
len : Chikou Legth (displaced source value)
perc : Percentage lookback period for Chikou Filter with defined how much candels of total length should be considered for backward filteration
_high : Ticker High Value
_low : Ticker Low Value
bull_col : Color to be returned if source value is greater than all candels within provided lookback percentage.
bear_col : Color to be returned if source value is lower than all candels within provided lookback percentage.
r_col : Color to be returned if source value is swinging around candles within defined lookback period which is an indication of consolidation or trend reversal.
Returns: Color based on trend. 'bull_col' if trend is bullish, 'bear_col' if trend is bearish. 'r_col' if no prominent trend. Integer Signal is also returned as 1 for Bullish, -1 for Bearish and 0 for no prominent trend.

Chiko-Span Momentum_PineScript_Version5This is Momentum indicator based on "Chiko-span" of Ichimoku Kinko-Hyo.
Differ from normal momentum indicator, this indicator is using "close" and "open" as default parameter which is based on 9 week-candle chart Invented by Ichimoku-Sanjin. And, It is located 26 period before to match chiko-span.
(Parameters can change as you like)
The usage is same as normal momentum indicator so please check momentum indicator usage. However, due to use this indicator, it may support to compare momentum of chiko-span movement and to predict effect 5 lines of ichimoku.
For example, when price break out tenkan-sen, you can measure slope or period of chiko-span momentum and compare previously chiko-span momentum. If momentum is stronger than previously price, we can think that price try to out kijun- sen, touch cloud or break out cloud.
I wish, this indicator helps ichimoku users.
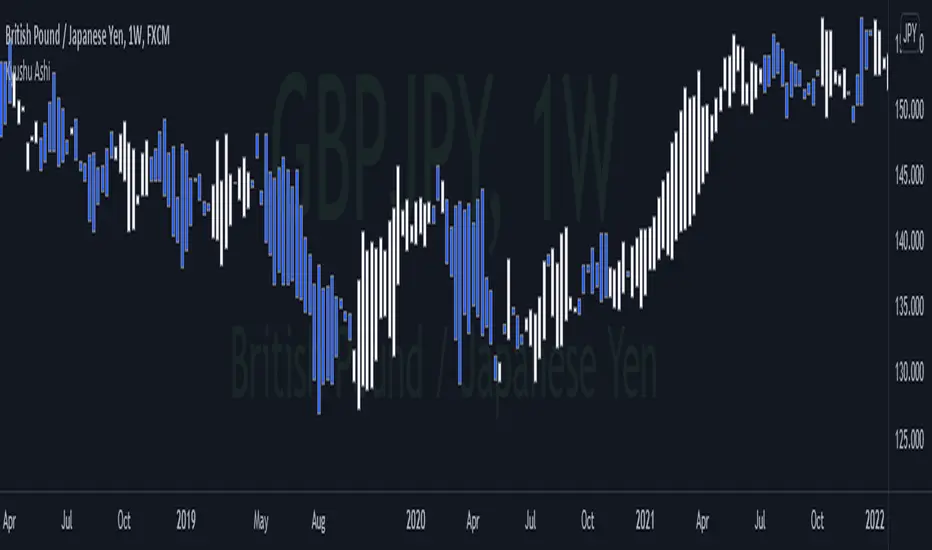
Kyushu AshiKyushu Ashi is one of the Ichimoku strategies which was originally introduced in Ichimoku Kinko Hyo Weekly book by Goichi Hosoda.
<< History >>
Back when Goichi Hosoda was sharing his market analysis in Miyako Newspaper, traders were hand-writing the open, close, high, and low price levels as well as 5 price values of Ichimoku (Tenkan sen, Kijun sen, Chiko span, Senko span A, Senko span B) every day. And because there was no PC back then, it was a bit too much of work. So traders asked Goichi Hosoda if they can simplify their analysis, and introduced Kyushu Ashi technique.
<< About Kyushu Ashi >>
Kyu means 9, Shu means week, Ashi means candles in Japanese. Kyushu Ashi is to capture market reverse and trend continuation on Weekly timeframe by using Kihon Suchi time cycles.
According to the original book, you cannot trade by Kyushu Ashi only. You need to use it together with Ichimoku 5 lines.
Stay Gold,
Kei
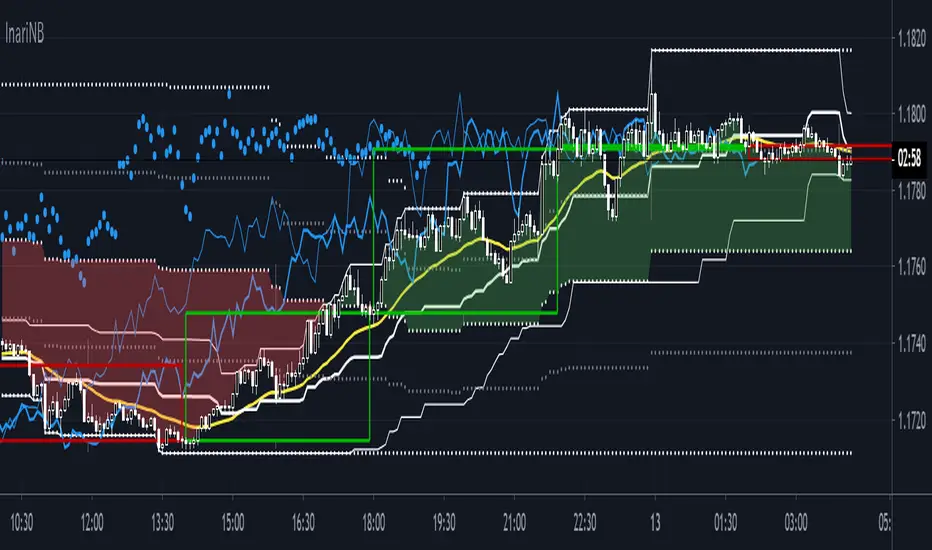
InariN BasicInariN is original work by N jijii.
I think InariN is modern interpretation of Ichimoku Cloud.
Please read script "InariN simple" for basic usage.
Multi time flame candles in this script is great work Candlestick Plot MTF by mortdiggiddy.
Supplementary explanation :
N jijii decided basic numbers as Ichimoku.
"I" first swing is 9. Only first swing is 9 because all numbers is consisted of nine numbers except start point 0 (his philosophy).
The second and subsequent is 8 because tangent point of previous swing is not counted (his philosophy).
"V" second swing is 9 + 8 = 17. "N" third swing is 9 + 8 + 8 = 25.
"N N = N2" is 25 +24 = 49. "N4" is 97. "N9"is 217.
He used basic numbers for parameters.
I think his idea is unique but the important point is this basic numbers are about popular numbers traders usually use and we can use as the same.
N2 and N9 spans is slightly difficult to use (Ichimoku lagging span).
Basically N span is used to measure Time Retracement and momentum.
If you want to practice Time Retracement , please check script "Ichimoku Time Retracement".
Enjoy!!
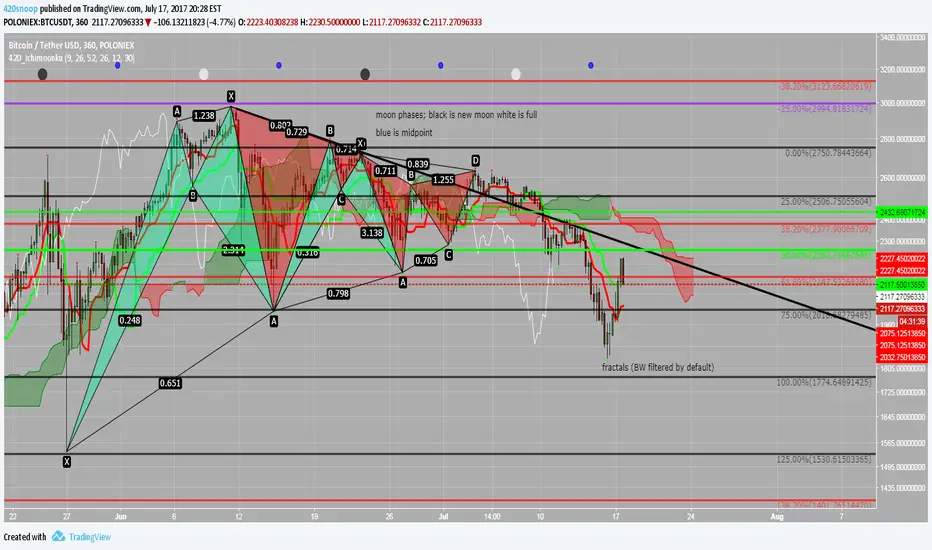
420_IchimoonkuSup all,
Snoop here with another script -- this time it is an ichimoku-type script. The ichimoku system is very powerful and the base script I have chosen to work from is the work of BrainZZ and Chris Moody; I added some alerts based on their signals and recolored to my liking. I suggest using the 'alert once per bar (on close)' if utilizing the alerts for TS crossing KS or the KS slope direction.
This script is great because it includes a moonphase indicator as well. This moonphase indicator was the work of Glaz and I appreciate the work he did on the base script which I have further modified and incorporated into this indicator. New moons are black, full moons are white, and the Q1 and Q3 are shown as blue.
The last thing in this script is the Williams Fractal and Higher High Higher Low fractal recognition. This is the work of JustUncleL and I appreciate the work he has done.
I hope everyone can get some good useage out of this it is packed full of some very powerful tools; feel free to PM me if you need resources on the ichimoku system or check out the education section of ichimoku_trader's posts.
As always good luck and happy trading!
xoxo
-- Snoop
Equilibrium Candles + Pattern [Honestcowboy]The Equilibrium Candles is a very simple trend continuation or reversal strategy depending on your settings.
How an Equilibrium Candle is created:
We calculate the equilibrium by measuring the mid point between highest and lowest point over X amount of bars back.
This now is the opening price for each bar and will be considered a green bar if price closes above equilibrium.
Bars get shaded by checking if regular candle close is higher than open etc. So you still see what the normal candles are doing.
Why are they useful?
The equilibrium is calculated the same as Baseline in Ichimoku Cloud. Which provides a point where price is very likely to retrace to. This script visualises the distance between close and equilibrium using candles. To provide a clear visual of how price relates to this equilibrium point.
This also makes it more straightforward to develop strategies based on this simple concept and makes the trader purely focus on this relationship and not think of any Ichimoku Cloud theories.
Script uses a very simple pattern to enter trades:
It will count how many candles have been one directional (above or below equilibrium)
Based on user input after X candles (7 by default) script shows we are in a trend (bg colors)
On the first pullback (candle closes on other side of equilibrium) it will look to enter a trade.
Places a stop order at the high of the candle if bullish trend or reverse if bearish trend.
If based on user input after X opposite candles (2 by default) order is not filled will cancel it and look for a new trend.
Use Reverse Logic:
There is a use reverse logic in the settings which on default is turned on. It will turn long orders into short orders making the stop orders become limit orders. It will use the normal long SL as target for the short. And TP as stop for the short. This to provide a means to reverse equity curve in case your pair is mean reverting by nature instead of trending.
ATR Calculation:
Averaged ATR, which is using ta.percentile_nearest_rank of 60% of a normal ATR (14 period) over the last 200 bars. This in simple words finds a value slightly above the mean ATR value over that period.
Big Candle Exit Logic:
Using Averaged ATR the script will check if a candle closes X times that ATR from the equilibrium point. This is then considered an overextension and all trades are closed.
This is also based on user input.
Simple trade management logic:
Checks if the user has selected to use TP and SL, or/and big candle exit.
Places a TP and SL based on averaged ATR at a multiplier based on user Input.
Closes trade if there is a Big Candle Exit or an opposite direction signal from indicator.
Script can be fully automated to MT5
There are risk settings in % and symbol settings provided at the bottom of the indicator. The script will send alert to MT5 broker trying to mimic the execution that happens on tradingview. There are always delays when using a bridge to MT5 broker and there could be errors so be mindful of that. This script sends alerts in format so they can be read by tradingview.to which is a bridge between the platforms.
Use the all alert function calls feature when setting up alerts and make sure you provide the right webhook if you want to use this approach.
There is also a simple buy and sell alert feature if you don't want to fully automate but still get alerts. These are available in the dropdown when creating an alert.
Almost every setting in this indicator has a tooltip added to it. So if any setting is not clear hover over the (?) icon on the right of the setting.
The backtest uses a 4% exposure per trade and a 10 point slippage. I did not include a commission cause I'm not personaly aware what the commissions are on most forex brokers. I'm only aware of minimal slippage to use in a backtest. Trading conditions vary per broker you use so always pay close attention to trading costs on your own broker. Use a full automation at your own risk and discretion and do proper backtesting.

Ichi Alerts StrategyThis Strategy is related to our Ichimoku Alerts Study script.
The strategy results below shows a strategy test on a 1 hour chart with standard crypto Ichimoku settings with personal TP and SL settings added.
(Starting capital $1,000, 100% equity per trade, 0.0075% fee included)
Within the strategy settings, there is a 'Disable Cross' option. In short;
- When cross is active, if the blue line crosses the white line after a signal, it will close the trade for you. This is beneficial as can effectively pull you out of a potentially losing trade.
> Note: You can alert this exit signal using the alerts options available in the study version, and of course add a webhook into the alert message so you can automatically close a trade based on this cross function
- When the cross is disabled, then your trade will stay open until you either hit your TP or SL target, or if another trade signal is fired
Standard TP and SL % options are included in the options.
This strategy does compound your trades for a realistic view on your strategy outcome.
Any questions please ask away in the comments.

MTF Ichimoku CloudI published it because I could not find a good MTF glance.
なかなか良いMTF一目が見つからないので公開しました。

MA(120,200), Bollingers and IchimokuFor you, people who want to put money in trading instead of Tradingview, and still want to have more than 3 indicators ❤
ABC_caluculator for Ichimoku Kinko Hyo(IKH) usersThis tool is using for calculating Target Value(N,V,E prices) by only clicking on a chart.
There is several points which makes it better.
Decrease the number of times of clicking.
Calculator needs a reset button, it's like loop structure. Push the reset and function again.
Plot percentages which it compare closing price and Target Value(N,V,E prices) on a chart.
Plot loss cut points from evaluating risk/returns.
My question is also written down precisely here !!!!!
↓
stackoverflow.com
Trendlines Boll Ichi S1 by GammaprodI. How to use this indicator :
------------------------------
I.1. Set your teadingview theme to dark theme.
I.2. Gammaprod indicator is valid for forex, stock and but more valid for crypto.
I.3. Use three timeframe for more validation (choose between those, that fit to your trading style) :
- Timeframe 1m, 5m, and 15m for Scalping
- Timeframe 30m, 1h and 4h for Intraday
- Timeframe 4h, 1D and 1W for Swing Trading
I.4 Always use THREE INDICATORS FROM GAMMAPROD, those three indicators is back to back each other, by the way, I only made those three indicators only (for now) :
- Trendlines Boll Ichi S1 by Gammaprod
- MACD Volume S2 by Gammaprod
- Stoch RSI Divs Zone S2 by Gammaprod
============================================================================
II. How to setting :
--------------------
II.1. Trendlines Boll Ichi Crypto by Gammaprod
II.1.A. Support and Resistance
- Well if you familiar with this indicator you can add it, but recommended for Timeframe 30m or more
II.1.B. Trendlines Primary or Trendlines Secondary
- Timeframe 1m you DON'T NEED Trendlines Primary or Trendlines Secondary
- Timeframe 5m you DON'T NEED Trendlines Secondary, but you CAN ADD Trendlines Primary if you fell it helpful (for me, it is helpful to find where the candles start or the end trend or a consolidation or where the candles will surpass a resistance or a support).
- Timeframe 15m you DON'T NEED Trendlines Secondary, DEFENITELY add Trendlines Primary it will help to find where the candles stop or a consolidation or where the candles will surpass a resistance or a support).
- Timeframe 30m or more, DEFENITELY NEED BOTH Trendlines Primary and Secondary Trendlines, it will help to find where the candle stop or consolidation or where the candle will surpass a resistance or support).
II.1.C. Bollinger, Ichimoku Cloud and Lagging Span
- Please DON'T CHANGE IT at all, it's really helpful to know when and where to make an entry decesion or a trend or a consolidation, if you don't understand how to read it, you better to learn it first (on "how to read" section and "How to OPEN position" the section below)
II.2. Stoch RSI Divs Zone Crypto by Gammaprod (DON'T CHANGE IT)
II.3. MACD Volume Crypto by Gammaprod (DON'T CHANGE IT)
============================================================================
III. How to read :
------------------
III.1. Sell or Buy Priority :
III.1.A. Sell Priority
- Color background on macd and stoch rsi is pink or purple sell is the priority, (if you're not sure to buy, just wait until the best moment to sell)
III.1.B. Buy Priority
- Color background on macd and stoch rsi Teal or light green buy is the priority, (if you're not sure to sell, just wait until the best moment to buy)
III.1.C. Indecision / Golden Moment
- Color background on stoch rsi yellow is indecision / golden moment of reversal pattern (wait until it formed background only on Stoch RSI), please be careful at this moment.
III.2. Trend / Consolidation :
III.2.A. BULLISH trend
- When Stoch RSI and MACD have teal or light green background that's means BULLISH trend, better to confirm by the candle is above green cloud and lagging span (red line) is also above the candle.
III.2.B. BEARISH trend
- When Stoch RSI and MACD have the Pink or purple background that's means BEARISH trend, better to confirm by the candle is above purple cloud and lagging span (red line) is also below the candle.
III.2.C. CONSOLIDATION
- When Stoch RSI have the mix background that's means CONSOLIDATION, better to confirm by the candle is in or near to green / purple cloud and lagging span (red line) is also on the candle.
III.3. Special Mark
III.3.A. Ideal Bullish :
- Near line 20 and green / teal background = When Stoch RSI have the char R / H on lime color label, that's means divergence or hidden divergence for buy position, if you not see this label that's means just a standard confirmation for buy
III.3.B. Not an Ideal Bullish :
- Near line 80 and green / teal background = if this happens make sure you know what happen, it could be a false signal or bullish continual pattern
III.3.C. Ideal Bearish :
- Near line 80 and pink / purple background = When Stoch RSI have the char R / H on lime color label, that's means divergence or hidden divergence for buy position, if you not see this label that's means just a standard confirmation for sell position.
III.3.D. Not an Ideal Bearish:
- Near line 20 and pink / purple background = if this happens make sure you know what happen, it could be a false signal or bearish continual pattern
III.3.E. The Beginning of Reversal (from BEARISH to BULLISH) :
- When Stoch RSI line shaping GREEN position is near 20.
- MACD lines still PINK, position lines is UNDER the HISTOGRAM, but the HISTOGRAM start to SHAPE FALL PINK (light pink) and the BACKGROUND still PINK / PURPLE.
- Position CANDLES NEAR BLUE line, NEAR PURPLE CLOUD, and lagging span (red line) STILL ON the area candle. (it used to be confirmed with the golden moment).
III.3.F. The Beginning of Reversal (from BULLISH to BEARISH) :
- When Stoch RSI line shaping PINK position is near 80.
- MACD lines still GREEN, position lines is ABOVE the HISTOGRAM, but the HISTOGRAM start to SHAPE FALL GREEN (light green) and the BACKGROUND still TEAL / GREEN.
- Position CANDLES NEAR WHITE line, NEAR TEAL CLOUD, and lagging span (red line) STILL ON the area candle. (it used to be confirmed with the golden moment).
III.3.G. False Signals, or It could be a Golden Moment (better to see it on TF 15 or bigger):
- Near line 20 or 80 and yellow background = When Stoch RSI have the char R / H on color label, that's means divergence or hidden divergence for buy / sell position, if you not see this label that's means just a standard confirmation for buy / sell depends on where the Stoch RSI line if near 20 that's means buy, near 80 means sell
============================================================================
IV. How to OPEN position:
-------------------------
IV.1. Bullish
IV.1.A. Trendlines Boll Ichi S1 by Gammaprod
- The candles above the green cloud.
- Lagging span (red line) above the candles.
- then open buy near yellow line (the first option) / blue line (the second option) (always confirm the position with two other indicators below).
IV.1.B. MACD Volume S2 by Gammaprod
- Teal or Green background.
- The lines is shaped or shaping green.
- Better if at the green histogram.
IV.1.C. Stoch RSI Divs Zone S3 by Gammaprod
- Teal or Green background.
- The lines is shaping green.
- Better if on the bottom (at a range 20).
IV.2. Bearish
IV.2.A. Trendlines Boll Ichi S1 by Gammaprod
- The candles below the purple cloud.
- Lagging span (red line) below the candles.
- then open buy near yellow line (the first option) / white line (the second option) (always confirm the position with two other indicators below).
IV.2.B. MACD Volume S2 by Gammaprod
- Pink or purple background.
- The lines are shaped or shaping green.
- Better if at the pink histogram.
IV.2.C. Stoch RSI Divs Zone S3 by Gammaprod
- Pink or purple background.
- The lines are shaping pink.
- Better if the line on the top (at a range 80).
IV.3. Consolidation
IV.3.A. Trendlines Boll Ichi S1 by Gammaprod
- The candles on the cloud (green or purple).
- Lagging span (red line) on the candles.
- then open buy near the white or blue line (always confirm the position with two other indicators below).
IV.3.B. MACD Volume S2 by Gammaprod
- Changing the background.
- The line is near the middle line.
- Have small Histogram.
IV.3.C. Stoch RSI Divs Zone S3 by Gammaprod
- Mix background specially on a timeframe 15m or more.
- The line move fast up and down.
- Better if on the bottom or the top of the lines (at a range 20 or 80).
============================================================================
>> The secret ingredient is comparing the timeframe :
The example scalping (Timeframe 1m, 5m and 15m)
- TF 1m is for making an open position.
- TF 5m is for making a judgement of the trend market.
- TF 15m is to confirm that judgement from TF 5m, be careful if it not similar then it used to be a consolidation or the beginning of the reversal.
There's a lot a way to open the position than above information that i gave it to you, but consider there are a limit chars on this column, I hope it will help your trading and make a more profit on it.

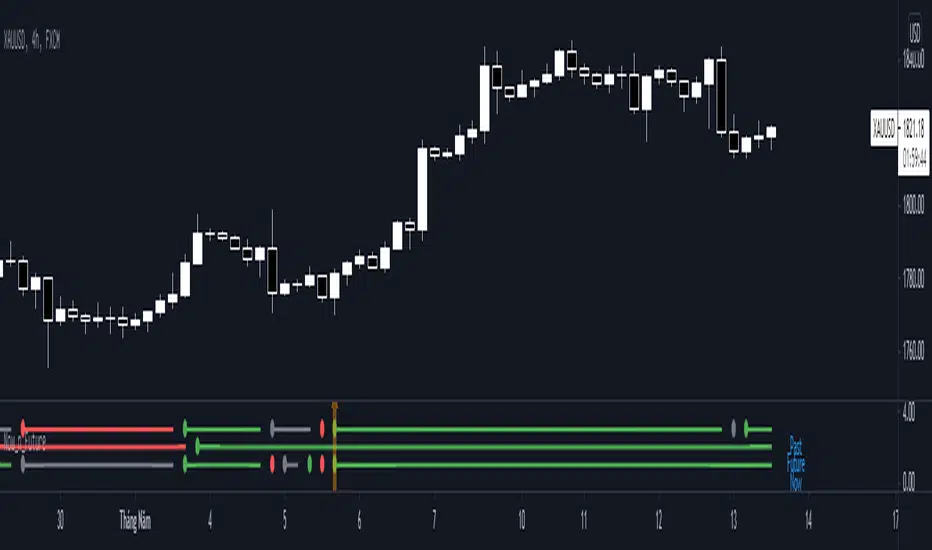
Now_n_FutureNow_n_Future base on Kumo cloud of Ichimoku Kinki Hyo system with detail below:
1. The Now Line
- When price moving above Kumo, color of now line is green.
- When price moving below Kumo, color of now line is red.
- When price moving inside Kumo, color of now line is gray.
- When price go into Kumo, now line appear gray dot.
- When price cross over Kumo, now line appear green dot.
- When price cross under Kumo, now line appear red dot.
2. The Future Line
- When Senkou Span A moving above Senkou Span B, color of future line is green.
- When Senkou Span A moving below Senkou Span B, color of future line is red.
- When Senkou Span A cross over Senkou Span B, future line appear green dot.
- When Senkou Span A cross under Senkou Span B, future line appear red dot.
3. Trading
- When color of both now line and future line is green, consider open Long position or close Short position.
- When color of both now line and future line is red, consider open Short position or close Long position.

Wave N + KDJ + Volumi + SMC + IchimokuWave N + KDJ + Volume + SMC + Ichimoku Indicator
Overview
This script is a multi-layered technical indicator designed to provide traders with enhanced market insights by combining five key methodologies:
• Wave N Pattern (Price Action)
• KDJ Oscillator (Momentum)
• Volume Filtering (Confirmation)
• Smart Money Concepts (Order Blocks) (Institutional Activity)
• Ichimoku Cloud (Trend and Support/Resistance)
By integrating these components, the indicator identifies high-probability trading signals, early warnings of trend shifts, and institutional price zones to improve decision-making in volatile markets.
⸻
How It Works
1️⃣ Wave N Pattern (Price Action Structure)
The Wave N pattern is a classic price action formation that helps spot potential trend reversals and continuations:
• A Bullish Wave N is detected when a higher low and a higher high structure appears.
• A Bearish Wave N is detected when a lower high and a lower low structure forms.
2️⃣ KDJ Oscillator (Momentum & Trend Strength)
The KDJ Indicator is a variation of the Stochastic Oscillator that adds a third line, J, to amplify sensitivity to trend movements.
• J > 50 indicates bullish momentum.
• J < 50 indicates bearish momentum.
• The script includes an early warning signal when J crosses 50, suggesting a possible trend shift.
3️⃣ Volume Filtering (Trade Confirmation)
To avoid false signals, the script integrates volume confirmation:
• A signal is valid only if the volume is above the 20-period EMA of volume.
• This ensures that trade signals are supported by strong market participation.
4️⃣ Smart Money Concepts (Order Blocks)
Order Blocks represent areas of institutional interest, where large traders accumulate or distribute positions.
• The script detects bullish order blocks (potential support) and bearish order blocks (potential resistance).
• These areas help identify optimal entry and exit points.
5️⃣ Ichimoku Cloud (Trend & Dynamic Support/Resistance)
The Ichimoku Cloud is used to confirm trend direction:
• Baseline (Kijun-sen) acts as a key trend filter.
• Senkou Span A & B form the cloud (Kumo), indicating dynamic support/resistance.
• Buy signals require price to be above the baseline, while sell signals require price to be below the baseline.
⸻
Trading Signals & Visual Elements
✅ BUY Signal (Green Arrow)
Occurs when:
• A Bullish Wave N forms
• J > 50 (Bullish KDJ Signal)
• Volume is above EMA threshold
• Price is above the Ichimoku Baseline
❌ SELL Signal (Red Arrow)
Occurs when:
• A Bearish Wave N forms
• J < 50 (Bearish KDJ Signal)
• Volume is above EMA threshold
• Price is below the Ichimoku Baseline
⚠️ Early Warning (Trend Shift Signal)
• An early warning appears when J crosses 50, indicating a possible upcoming trend shift.
• The line color changes based on the potential move:
• Green/Blue → Possible Uptrend
• Red/Orange → Possible Downtrend
⸻
Why This Indicator is Unique?
Unlike simple trend-following indicators, this script:
• Combines Price Action, Momentum, Volume, and Institutional Order Flow for a multi-dimensional approach.
• Filters out weak signals using volume confirmation and Ichimoku.
• Provides early warnings before major trend shifts.
• Visualizes Smart Money Order Blocks, giving traders an edge in spotting institutional zones.
⸻
Best Timeframes & Markets
📊 Recommended Timeframes:
• 1H & 1D (works best on medium/long-term trends)
💹 Markets:
• Crypto, Forex, and Stocks
This indicator is designed for traders who value confluence and strong confirmation in their strategies. Whether you are a trend trader, swing trader, or institutional flow analyst, this tool can help refine your decision-making process.
🚀 Optimize your trades with Wave N + KDJ + Volume + SMC + Ichimoku! 🚀

ATAMOKU: A Hierarchical Scoring Tool Based on Ichimoku Principle
Overview and Purpose of ATAMOKU
The name "ATAMOKU" combines “Ata” (meaning “ancestor” in Turkish) and “Moku” (meaning “cloud” in Japanese). ATAMOKU is built on Ichimoku principles, designed to assist traders in analyzing trend direction and strength. By providing a structured, score-based approach, ATAMOKU aims to make Ichimoku data more accessible for identifying potential entry and exit points.
How ATAMOKU Works
ATAMOKU uses Ichimoku’s essential elements—including the Conversion Line (Tenkan-sen), Base Line (Kijun-sen), and Leading Spans A and B—and applies a scoring hierarchy to assess market conditions. The scoring system measures trend strength and alignment by comparing the relationships between these elements. This method allows ATAMOKU to produce an objective score that reflects whether the market is in an “ideal” or “non-ideal” state.
Key Features of ATAMOKU
1 - Hierarchy-Based Scoring System:
ATAMOKU calculates a score that represents the strength and direction of the current trend. Each component of Ichimoku is assigned a weight, and the indicator scores these components based on their hierarchical position. When all components align for an upward trend, ATAMOKU’s score will approach +364 (representing an ideal state). In contrast, a score of -364 indicates a non-ideal or bearish alignment.
2 - Optimal and Suboptimal Tracking:
ATAMOKU includes Optimal and Suboptimal markers to track the highest and lowest scores over a specific period, with a default of 52 periods. The Optimal score captures the highest recorded value within the period, while the Suboptimal score captures the lowest. These markers help traders gauge how current conditions compare to recent peaks and troughs, indicating market stability or volatility.
3 - Real-Time Scoring Display (Hierarchy Table):
ATAMOKU uses a Hierarchy Table adjacent to the main chart to present real-time scoring data for each Ichimoku component. This table displays values for Conversion Line, Base Line, Leading Spans, and Lagging Span, providing traders with a detailed view of each component’s contribution to the total score. By referencing the table, traders can understand the weight and impact of each Ichimoku element on the overall score.
4 - Histogram Visualization:
ATAMOKU’s scores are displayed on a histogram with green and red bars to indicate market sentiment. Green bars represent bullish conditions, while red bars indicate bearish conditions. This visual format allows traders to quickly assess trend direction and strength at a glance, providing context for decision-making.
5 - Signal and Smoothing Lines:
To help reduce noise, ATAMOKU features Signal and Smooth lines, which can be customized using different smoothing methods (such as SMA, EMA, or WMA). When the Signal and Smooth lines cross, the indicator will label the trend as UP or DOWN based on the direction of the crossover. This feature helps traders detect potential reversals or trend confirmations.
6 - Adjustable Settings:
* Scoring Weights: Traders can configure the relative weights of each Ichimoku component to match their analysis preferences.
* Smoothing Techniques: Users may choose from SMA, EMA, and WMA smoothing methods to adjust signal sensitivity.
* Period Adjustments: Scoring and smoothing period lengths can be customized to fit various trading styles and time frames.
Intended Use and Practical Application
ATAMOKU is best used alongside the Ichimoku Cloud, as its scoring and signal features complement the visual data provided by Ichimoku. The Hierarchy Score, combined with Optimal/Suboptimal markers, gives traders insight into the current market conditions and allows for comparisons across time. ATAMOKU is adaptable to any time frame and provides both trend analysis and potential entry/exit signals based on Ichimoku principles.
Legal Disclaimer
ATAMOKU is a technical analysis tool and does not guarantee profitability. It is designed to aid in decision-making by providing additional market insights. Traders are encouraged to exercise their judgment and assume responsibility for their trading actions.
