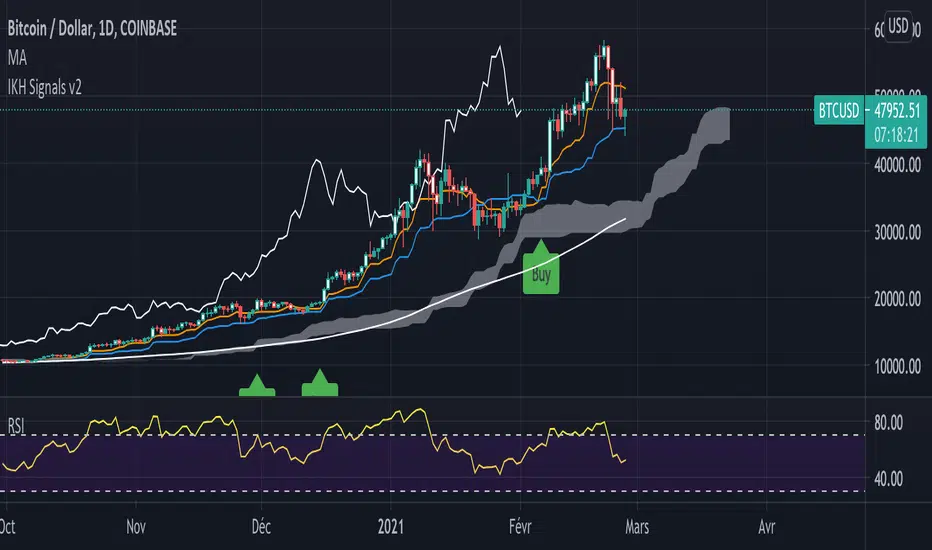
IKH Signals v2Ichimoku Kinko Hyo Signals
This script show signals based on my understanding in Ichimoku Kinko Hyo and is an evolution of this script
Instead of using my own functions, I use now the ones provided by pine script
/!\ Please do not follow signals blindly and always make your own analysis /!\
Signals explanation
Buy : Price above kumo, tenkan above kijun, chikou span above candles and kumo and price break previous 9 candles high
Strong Buy : Is a Sanyaku Kouten and can show a potential reverse in current tendance
Sell : Price below kumo, tenkan below kijun, chikou span below candles and kumo and price break previous 9 candles low
Strong Sell : Is a Sanyaku Gyakuten and can show a potential reverse in current tendance
Exit : Show a potential time to take profit based on previous Sell, Strong Sell, Buy, or Strong Buy signal
Buy Colored bard : bar a colored between a buy signal and an buy exit signal, based on this conditions : kumo up, SSA or SSB up and kijun up
Sell Colored bard : bar a colored between a sell signal and an sell exit signal, based on this conditions : kumo down, SSA or SSB down and kijun down
How to use it
When a signal is triggered
A signal ( strong or not ) show a new entry point. You can start looking for an entry in lower timeframe according to the signal direction.
A colored bar means that the price is pushing in a direction according to the previous signals, It's a good moment to look for an entry in lower timeframes.
Alerts
You can configure alerts for Strong buy, buy, Strong sell, sell and both exit signals
Cerca negli script per "ichimoku"
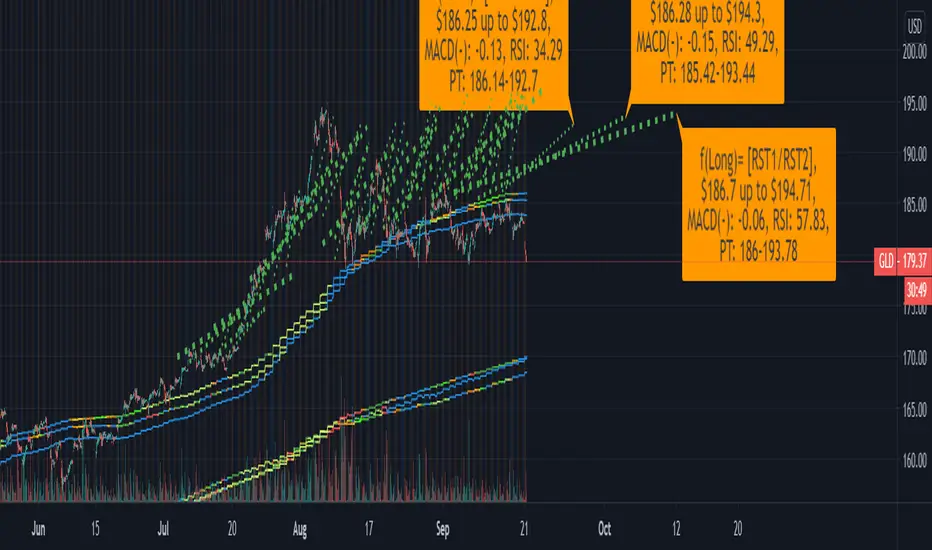
LAGging span leaves Bollinger Bands strategyAbstract
This script points out the positions a lagging span leaves a Bollinger Band.
This script does not plot a lagging span but moves the Bollinger Band forward.
You can find profit opportunities by combining this script and risk management.
Introduction
Bollinger Bands is a popular indicator.
It contains a moving average, an upper band and a lower band.
The moving average can indicate trend, the upper band and the lower band can indicate if the price is far away from the moving average.
However, in trading markets, anything can happen.
Both continuation and reversal are possible when the price touches the moving average, the upper band or the lower band.
Therefore, many traders adjust the parameters of the Bollinder Band or add other indicators to improve their trading strategies.
@Daveatt et. al. provided an idea that uses a lagging span.
A lagging span is a line chart. It displays the reference price but in earlier time.
For example, if the offset of a lagging span is 26 days, the value of the lagging span on 29 days ago is the reference price 3 days ago.
A lagging span is a part of Ichimoku Cloud.
It can compare the price to the earlier price and the values of indicators in the past.
To compare the price to the values of indicators in the past, we can also shift indicators forward instead of adding a lagging span into the chart.
This script uses shift-the-indicators-forward method.
In other words, this script plots the Bollinger Band forward so that the price can be compared to the values of the Bollinger Band in the past.
Computing and Adjusting
(1) Compute Moving Average
(2) Compute Standard Derivation
(3) Upper Band = Moving Average + Standard Derivation * Multi
(4) Lower Band = Moving Average - Standard Derivation * Multi
(5) Shift the Bollinger Band forward according to the offset parameter.
(6) Mark the points the price leaves the shifted Bollinger Band
(7) Compute the most possible loss and profit before the next opposite signal.
Parameters
source : the data for computing the bollinger band. can be open, high, low, close or their combination.
length : how many days are calculated by the bollinger band
mult : the distance from the moving average to the upper band and the distance from the moving average to the upper band is equal to ( mult * standard derivation ) .
x_offset : the offset of the lagging span
Conclusion
This script can find signals for potential breakout or trend continuation.
If you want to use this signal well, you need to know when to cut loss and protect the profit.
Reference
@Daveatt , Bollinger bands/Lagging span cross , BGyrPgOA , Tradingview 2019
How to trade with Bollinger Bands
How to use Ichimoku Cloud
How to trade with a line chart

MA ICHI BB [Rogulabo]3 indicators in 1.
Included Indicators are:
- MA 5,25,50,100,200
- Ichimoku
- Bollinger Band
These can be used to determine changes in trends when:
- MA's collide, trajectories shift, or certain levels are reached.
- Ichimoku cloud is above or below the candles.
- Bollinger Band's width changes, or range is broken.
Reasons for 3 in 1 assembly:
This indicator is intended to be used by students, and followers of Dan Takahashi
(a prominent educator of investing in Japan who is also a user of TradingView) .
Those who wants to use and learn with the same setup as Dan, would greatly benefit from this since,
the complex setting up process which can be a pain for beginners can be skipped with a simple click.
Every stylistic choice of color and placement were made to make it similar to the chart used by Dan.
Simple customizations are available such as:
- Changing color
- Changing the values
- Hide/show controls
Notes:
This is intended to be used alongside “CC RSI” for the complete the setup.
Any questions, please refer to:
@rogulabo
==
高橋ダンさんが使用されてるチャートと同様のセットアップの為にご活用ください。
複数のインジケータをグループにしておりますので、無料版を使われてる方は効率よく使っていただけると思います。
また、“CC RSI ”どいうタイトルのインジケータも同時に公開しておりますので、セットアップを完成させたい方はこちらもご活用ください。
以下のインジケータを含みます。
・MA線
・一目均等表
・ボリンジャーバンド
カスタマイズされたい方はご自由に値を変更ください。
ご質問は @rogulabo までよろしくお願いいたします。

Companion::DivergentCompanion::Divergent is a combined indicators strategy optimized for Bitcoin Markets and tested on Bitfinex.
Mainly, it is an Ichimoku based strategy.
Used indicators:
- Ichimoku (displayed on chart): trendline analysis;
- Double Hull MA (displayed on chart): trendline analysis;
- MACD (not displayed): confirmative/momentum detection;
- CCI (not displayed): confirmative/momentum detection;
- ATR: used toghether with Ichimoku to determine Stop Loss/Take Profit levels;
- VWMA: For implementing trailing stop orders based on volumes.
What the script does:
- determines trendlines combining mulitple indicators;
- automaticlally calculates Take profit and Stop Loss levels;
- permits automation generating Autoview signals;
- supports for margin trading. Spot trading will be added in the future.
It can be used on 1D or 1H timeframes but it can be adapted for other time frames tweaking the parameters. I used it a lot on Bitfinex on 1H timeframes. Please check parameters: if you will use the strategy on D or higher timeframes, the "Legacy Chikou analysis" option should be checked.
BACKTESTING
Backtest is not leveraged. Defaults are set as follow:
Capital: 10000
Percent of equity used for trades: 10%
Commission: 0.18% this is Bitfinex commission on orders
Change them accordingly on how you trade to get a more realistic backtest results.

Jackrabbit.modulus.IchimokuCloudThis is Ichimoku Cloud for the Jackrabbit suite and modulus framework.
The Ichimoku Cloud is a time tested approach heralded by beginners and experts alike. This module is the purest implementation I could develop. It allows for full tunability while allowing all of the modulus framework features, including confirmation bias and differential timeframe analysis.
The Tenkan, Kijun, Sekou A, Sekou B, and Displacement are all user configurable. There is also a special aggressive setting that leverages the Ichimoku Cloud in an unique way for dollar cost averageing.
The Jackrabbit modulus framework is a plug in play paradigm built to operate through TradingView's indicator on indicatior (IoI) functionality. As such, this script receives a signal line from the previous script in the IoI chain, and evaluates the buy/sell signals appropriate to the current analysis.
This script is by invitation only. To learn more about accessing this script, please see my signature or send me a PM. Thank you.

Multi StrategyDuring the course of a trade, we can find ourselves changing strategies depending on the market. Instead of using many different templates, I have a simple indicator that clearly says "Buy", "Sell" or "Stay Out". The great thing about this approach, is we instantly observe the majority are in agreement and that decides which way to place our trade.
This indicator includes the following strategies:
- QQE
- Ichimoku using much faster settings.
- Parabolic SAR
- Supertrend
- TTM Oscillator
- The Squeeze strategy
- The Alligator Strategy
Using this indicator is simple, if the lines are mainly green then buy, if mainly red then sell OR don't trade. So...
Green Line - This strategy is in a buy position
Orange or Black Line - This strategy is undecided
Red Line - This strategy is in a sell position
There are also some green and red circles for reference that appear showing when that bar has broken through the Ichimoku cloud.
The trader's approach is simple, when all indicators are green or red, then take the trade. As soon as one indicator changes, then re-evaluate using your normal process, such as price action, to determine whether to close the trade or continue.
I can customise this further or add other strategies, please message me.

ELLIPSE: Bidirectional Swing Trading Strategy (Strategy Version)The eternal question that has occupied humanity since its early existence is what is the meaning of life and why am I here? On a daily basis this quest for meaning is distilled into a somewhat simpler question: What is the reason for getting up every morning?
For many of us, these thoughts arise even more as autumn arrives and it gets dark, bleak and cold outside. I guess it is easier to forget about the meaning of your life, while swimming on a sandy beach, enjoying a cocktail. Than you are living you life and you don’t need to rationalize it. Everything makes perfect sense!
In winter however, you need to get more “creative”. I, for example, would always try to change my perspective of things by doing something that makes my heart beat faster, like drinking a bottle of Heineken on a Friday evening or having endless conversations with my mates about stupid things, or kicking a ball against BALLONTHEROOF 7 on a Saturday morning. During the week, I would take out my frustrations on the fitness equipment at the local gym.
But what if all of this is canceled by CORONA? All that’s left is to work for the boss and run your 10km lap twice a week. The question is, what do you do now, with this huge amount of ”free” time than any old person would give anything for. When you are young time is never ending, when you are older it is never enough. Time has reached a different dimension in these days.
However, you can still do 2 things. You can slowly let the walls come to you and give up or you can actually do something useful with your time and find something that you are good at.
For us this choice was easy. After the success of our positioning trading strategy the MATRIX, at the time of the corona lockdown, we started making a swing trading strategy for the 4H timeframe, called ELLIPSE. We have included all feedback and any improvements we received about the positioning strategy and integrated it into the 4H script.
The main requirements of the script that we had set ourselves were:
Bidirectional
Low max drawdown
High profit factor
Works on all main crypto coins
By fully focusing ourselves on the script over the past few months, I can’t help but (unhumbly) say that we have not only succeeded in our mission, but that we have absolutely surpassed ourselves!
The only bright spot in this heavy corona time is, if a drug becomes available, there is extra money in the bank!
***The script is invite-only, message us to get script access***
-------------------------------------------------------------------------------------------------
User Guidelines:
The trading strategy was designed and optimized for trading cryptocurrencies only; furthermore it works best on established cryptocurrencies that have a clear historical trend such as:
BTCUSD
ETHUSD
LTCUSD
XRPUSD
ADAUSD
The trading strategy is based on swing trading methodology. The script must therefore be used on 4h candles only .
Use USD trading pairs only (e.g. use ETHUSD instead of the ETHBTC) since the individual trend is captured more effectively and therefore gives better results.
The trading strategy is bidirectional , both long and short entries are generated.
-------------------------------------------------------------------------------------------------
Indicators used in this strategy:
Ichimoku Cloud ; acts as the leading indicator.
Volume ; without strong volume , a market move is not valid.
MACD and Vortex ; both being used as confirmation indicators.
Choppiness index ; avoids trading in choppy markets.
Simple and Exponential Moving Averages ; prevents trading against the trend.
The trading strategy is easy to use, bidirectional, trend based and without repainting, meaning once a signal has been made it is permanent and that no future data is used in the decision making. It detects the trend and filters out market noise based on more than 10 technical indicators. ONLY when all indicators align with each other the algorithm prints a LONG or SHORT signal. The trading strategy provides high probability trading signals and minimizes risk! This script aims to capture the profit from short to medium trending moves and by doing so filters out non-substantial trends and avoids the associated risks with these trades.
-------------------------------------------------------------------------------------------------
Features:
NO Repaint once candle is closed.
Stop loss feature ; set your own stop loss to manage your risks.
Customizable Display for the Ichimoku cloud indicator display.
Bidirectional ; both long and short trading positions can be enabled.
Full backtest feature ; Easily generate your own backtest results for each asset (Strategy Version Script).
Alerts ; Get notified via email / pop-up / sms / app once a signal is given! (Alert Version Script).
-------------------------------------------------------------------------------------------------
Backtest results
Below are the back test results. Only well established cryptocurrencies are displayed with a clear historical trend:
Long and short trading positions,
Signal to signal trading (no multiple orders),
Initial Capital: 10 000 USD,
Order size: 10% of equity per trade,
commission fee 0.1%, period: start of chart,
Exchange-----Asset------Timeframe---Percent Profitable----Profit Factor---Total Trades----Max Drawdown----------Net Profit------
Bínance------BTCUSDT------4H-----------------54.4---------------5.32-----------------57----------------1.58%------------40.34%-(4034 USD)
Bínance------ETHUSD-------4H-----------------50.9---------------5.01---------------- 57----------------2.96%------------54.93%-(5493 USD)
Bínance------LTCUSD--------4H-----------------61.0---------------5.08-----------------59----------------2.09%------------57.06%-(5706 USD)
Bínance------XRPUSD-------4H-----------------43.13--------------3.52-----------------51----------------2.42%------------43.13%-(4313 USD)
Bínance------ADAUSD-------4H-----------------57.5---------------3.36-----------------47----------------3.46%------------40.82%-(4082 USD)
-------------------------------------------------------------------------------------------------
Reminder: Use this trading strategy at your own risk and trade responsibly. We are not responsible for any financial loss using this strategy.
***The script is invite-only, message us to get script access***

ELLIPSE: Bidirectional Swing Trading Strategy (Alert Version)This is the alert version of our original script ELLIPSE: Ultimate Bidirectional Swing Trading Strategy.
This release has the same internal algorithm as the ELLIPSE Strategy script. But instead of showing back test results, this script provides the functionality to add alerts that can notify the user via email / pop-up / sms / app once a signal is given! You must manually add these alerts via TradingView. If you need help setting up these alerts, feel free to ask in the comment box or send us a dm.
***The script is invite-only, message us to get script access***
-------------------------------------------------------------------------------------------------
User Guidelines:
The trading strategy was designed and optimized for trading cryptocurrencies only ; furthermore it works best on established cryptocurrencies that have a clear historical trend such as:
BTCUSD
ETHUSD
LTCUSD
XRPUSD
ADAUSD
The trading strategy is based on swing trading methodology. The script must therefore be used on 4h candles only .
Use USD trading pairs only (e.g. use ETHUSD instead of the ETHBTC) since the individual trend is captured more effectively and therefore gives better results.
The trading strategy is bidirectional , both long and short entries are generated.
-------------------------------------------------------------------------------------------------
Indicators used in this strategy:
Ichimoku Cloud ; acts as the leading indicator.
Volume ; without strong volume , a market move is not valid.
MACD and Vortex ; both being used as confirmation indicators.
Choppiness index ; avoids trading in choppy markets.
Simple and Exponential Moving Averages ; prevents trading against the trend.
The trading strategy is easy to use, bidirectional, trend based and without repainting, meaning once a signal has been made it is permanent and that no future data is used in the decision making. It detects the trend and filters out market noise based on more than 10 technical indicators. ONLY when all indicators align with each other the algorithm prints a LONG or SHORT signal. The trading strategy provides high probability trading signals and minimizes risk! This script aims to capture the profit from short to medium trending moves and by doing so filters out non-substantial trends and avoids the associated risks with these trades.
-------------------------------------------------------------------------------------------------
Features:
NO Repaint once candle is closed.
Stop loss feature ; set your own stop loss to manage your risks.
Customizable Display for the Ichimoku cloud indicator display.
Bidirectional ; both long and short trading positions can be enabled.
Full backtest feature ; Easily generate your own backtest results for each asset (Strategy Version Script).
Alerts ; Get notified via email / pop-up / sms / app once a signal is given! (Alert Version Script).
-------------------------------------------------------------------------------------------------
Backtest results
Below are the back test results. Only well established cryptocurrencies are displayed with a clear historical trend.
Back test results: (long and short trades, signal to signal, order size: 100% of equity, commision fee 0.1%, period: start of chart)
Exchange-----Asset---------Timeframe---Percent Profitable----Profit Factor-----Total Trades----Max Drawdown---Average bars in trade-----Net Profit
Bínance------BTCUSDT---------4H-----------------54.4---------------3.37-------------------57----------------14.9---------------------38------------------1978
Bínance------ETHUSD----------4H-----------------50.9---------------3.48------------------- 57---------------26.8----------------------37------------------3953
Bínance------LTCUSD-----------4H-----------------61.0---------------3.15-------------------59----------------20.9---------------------33------------------3098
Bínance------XRPUSD----------4H-----------------43.1---------------2.44--------------------51---------------22.4----------------------26------------------1226
Bínance------ADAUSD----------4H-----------------57.5---------------3.47--------------------47---------------34.7----------------------35------------------1233
-------------------------------------------------------------------------------------------------
Reminder: Use this trading strategy at your own risk and trade responsibly. We are not responsible for any financial loss using this strategy.
***The script is invite-only, message us to get script access***

The MATRIX: Ultimate Crypto Position Strategy (Alert Version)Welcome back everyone,
It's been a while since our last post. In recent months we have worked on all kinds of projects, but more on that later. In the meantime, we also received a lot of positive feedback about our original 'The MATRIX: Ultimate Crypto Position Strategy' script.
One of the many requests was whether we could release an alert version.
However, since Pinescript does not provide the alert functionality in a strategy type script, it had to be converted to a study type script. Besides that, we have also added a stop-loss functionality. This release has the same internal algorithm as the original 'The MATRIX: Ultimate Crypto Position Strategy' script. But instead of showing back test results, this script provides the functionality to add alerts that can notify the user via email / pop-up / sms / app once a signal is given! You must manually add these alerts via TradingView. If you need help setting up these alerts, feel free to ask in the comment box or send us a dm.
***The script is invite-only, message us to get script access***
-------------------------------------------------------------------------------------------------
The MATRIX: Ultimate Crypto Position Strategy should be used as follows:
• The trading strategy was designed and optimized for trading cryptocurrencies only ; furthermore it works best on established high market cap cryptocurrencies that have a clear trend such as:
BTCUSD
ETHUSD
LTCUSD
XRMUSD
EOSUSD
ADAUSD
DASHUSD
ETCUSD
• The trading strategy is based on swing/position methodology. The script must therefore be used on daily timeframe candles only (1D).
• Use USD trading pairs only (e.g. use ETHUSD instead of the ETHBTC) since the individual trend is captured more effectively and therefore gives better results.
-------------------------------------------------------------------------------------------------
The MATRIX:Ultimate Crypto Position Strategy is based on the following indicators:
• Ichimoku Cloud ; acts as the leading indicator.
• Volume ; without strong volume , a market move is not valid.
• MACD and Vortex ; both being used as confirmation indicators.
• Choppiness index ; avoids trading in choppy markets.
• Bullish/ Bearish Regular Divergences in combination with RSI to spot tops and bottoms.
• Simple and Exponential Moving Averages ; prêvents trading against the trend.
The trading strategy is easy to use, trend based and without repainting, meaning once a signal has been made it is permanent and that no future data is used in the decision making. It detects the trend and filters out market noise based on more than 10 technical indicators. ONLY when all indicators align with each other the algorithm prints a BUY or SELL signal. The trading strategy provides high probability trading signals and minimizes risk! This script aims to capture the profit from longer term trending moves and by doing so filters out non-substantial trends and avoids the associated risks with these trades.
-------------------------------------------------------------------------------------------------
The MATRIX: Ultimate Crypto Position Strategy has the following features:
• ALERTS can be enabled which can notify the user through email/popup/app once a signal is given.
• Automatically generated Buy / Sell alerts in the form of a label.
• NO Repaint once candle is closed.
• SAFEGUARD ; custom built-in security prevẹnts trading when the price is out of equilibrium.
• Customizable Display for the Ichimoku cloud indicator display.
-------------------------------------------------------------------------------------------------
Reminder: Use this trading strategy at your own risk and trade responsibly. We are not responsible for any financial loss using this strategy.
***The script is invite-only, message us to get script access***

CC - ATP (Auto-Trendline Projection)I created this script with a simple goal in mind: Automatically plot trend-lines for a given interval with a resolution that fits the period chosen.
To accomplish this I used a combination of the following:
Ichimoku Spans and Ichimoku Span Width.
ATR and standard deviation from the ATR of the Ichimoku width.
Rolling MACD with directional RSI for coloration based on acceleration.
I then combined all of these pieces of data into a single label and line plotter, so that you can see the assumed trend-lines for the current period based on the interval selected. It attempts to avoid using look-ahead logic by resolving using security, and plotting based on the suggested methodologies.
Inputs:
n (this must be the smallest number). - This is usually 7,14 or 26 depending on the resolution you're going for.
m (must be m > n and m < o). - This is usually something close to 14,26 or 52.
o (must be o > m and o < p). - This is usually something close to 26,52 or 180.
p (must be p > o). - This is usually just o * 2 or 52, 180 or 360.
Show historical data - Keeps some of the lagging trend-lines at intervals of m, o and p.
Precision - The decimal precision to round to, useful if you need this for BTC or penny stocks.
Common Inputs I use:
n=7, m=14, o=26, p=52
n=14, m=26, o=52, p=180
n=26, m=52, o=180, p=360
You can use any numbers, but roughly you want:
m = n*2, o = m*2, p = o*2.
The labels contain the following information:
Expected Support/Resistance levels
The first level is assumed to be heading to the second level.
For instance, if you have S1 down to R2, that means a support is likely to become a resist.
If you have, instead, R1 up to R2 that means the resistance is moving up, but is still resist.
S1 down to S2 is similar in that it means the support level is moving lower but is still sup.
R1 up to S2 is the one that you want to look for as it indicates potential swings.
More-overly, R1-->S2 or S1-->R1 indicate pivotal moments.
MACD / RSI for the given period.
Pretty simple, it's given to the number of decimal places offered by the inputs.
Price Targets.
If it's above the price target area, that means the swing already probably happened.
If it's in the price target area, you're at a pivotal moment; it could go up or down.
If you're below the price target area, watch for catalysts that force price target entry.
WARNING:
Please note, all of this is trend analysis and can be completely demolished in an instant by a catalyst. If there is a huge retracement event, you MUST WAIT A MINIMUM OF THE INPUT PERIOD OF TIME FOR THE STOCK TO SETTLE. If you have a retracement within n-m periods for instance, the short data will be inaccurate. If you have a retracement from m-o the mid data may be inaccurate until it triggers retracement. Same with o-p on the long level. The higher numbers you use, the less reactive the script, but the more historical data it will consume. For instance high numbers may be good for amazon, so you have less reaction to big dips, as you are not afraid because it is a strong company. While this is good on strong companies, it is suicidal for unknown ones.
DISCLAIMER:
I do NOT state anywhere that the data provided by this indicator is valid, forward looking, or guaranteed. If you make a trade based on this indicator I am in no way responsible for the outcome. All trades should be backed by personal due diligence and not rely directly on the indicators of others, as they may contain unfound bugs, incorrect math or look-ahead logic that is potentially dangerous. One final disclaimer, I am a programmer at heart, and am new to this field of study. While I have found a group of supportive friends, do realize I have been at this for less time than most others, more notably I started on 8/16/2020. Please shower me with constructive criticism and other thoughts you have.
Please take this script and view it as a learning experience not a tool for money as of this moment, if you have further questions about me or my scripts, please feel free to message me.
KTSThis Indicator with Alert function is based upon the ichimoku trading strategy of Japanese Forex Trader Kei.
It's best to use it together with the ichimoku indicator.
Hope you like it !

Box FR-SHLBox SH-SL and breakout :
Box SH-SL and Fixed range :
Box sigH-sigL and breakout :
Used better when combining ichimoku candles :
+ Candles.white = bull
+ Candles.yellow = bear
+ The numbers shows how many candles breakout
+ The " Kumo cloud " represents 2 factions
Trend Follow with kijun-sen/tenkan sen for 1 Hour SPX
This script determines, plots and alerts on probable trend initiation and continuation points, using tenkan-sen(conversion line of ichimoku), kijun-sen(baseline of ichimoku) and stochastic RSI, for 1 H SPX.
New long/short trend initiates when prices cross above/below kijun sen. The trend continues when prices cross above/below tenkan-sen or stochastic RSI crosses up/down its signal line, while prices are above/below kijun-sen.
It is good to take partial profit between 10-15 points gain and trail the left with stops below kijun-sen line.
While placing the order, using 2-3 points buffer above/below of signal bars is recommended. Additionally, please be careful about clouds and do not place long/short orders below/above clouds.

Dark strategy 1this strategy for bitcoin only on 30 min
you can use it by adjusting the entry values
this is based on ichimoku kinko hyo cloud and RSI
use ichimoku kinko hyo cloud for jumps and full
and use RSI in Oscillating situation
by your comment about it make we be aware of your idea

The MATRIX: Ultimate Crypto Position StrategyHi all,
We are cryptocurrency miners and 'hodlers’ since 2013, with unwavering confidence in the technology behind it. We’d always thought that it would be a life-changing êvent. And we were right. We went from “broke” to making shit loads of money and all the way back to bitter nothing. If you are lucky, you probably haven’t experienced what if feels to be high on cash and then fall very deep low, but let me reassure you, it is a nasty feeling.
Then we wondered, what the hell did we do wrong? Or better say, what didn’t we do right! The answer was dead simple: We had no experience in trading, we were overwhelmed by emotions and we didn't use any trading strategy. Hence, we were doomed to fail from the beginning.
In order to build an all-in-one profitable trading strategy, we had to start from zero. The one thing we learned is that your goal for financial gain cannot be achieved without discipline and consistency. Our prime focus was to absorb as much info as possible regarding trading and coding by doing an extensive self-study, which consequentially took us to the next level.
One of the secrets to being successful from a trading perspective is to have an indefatigable and undying thirst for information and knowledge. As Bruce Lee once said: “Learning is never cumulative; it is a movement of knowing which has no beginning nor end”. So, we adapted what was useful, rejected what was useless, and added our own preferences based on our mindset. We were totally committed to be the best. Our goal was never to lose money again! Of course, this is an illusion, as no single strategy is correct all of the time.
Therefore, the final trading strategy was based on the following key elements:
• The avoidance of risk is more important than absolute profit. Do not anticipate and do not move without market confirmation. Being a little late in your trade is your indication if you are right or wrong.
• Offering simplicity and practicality, for those that do not have the time to trade 24/7.
• Believe in analysis and not in forecasting. Trading is a skill for those who are smart and gambling for those who are not.
In conclusion, we are absolutely thrilled to finally release this trading strategy after one year of extensive back testing and optimization. The script was supposed to be for personal use only, but because Tradingview has helped us a lot in this process, we want to share it with all of you and give something back to this amazing community. If you learned something new today and found value, please give us a like to show your support! We’d really appreciate it.
***The script is invite-only, message us to get script access***
-------------------------------------------------------------------------------------------------
The MATRIX: Ultimate Crypto Position Strategy should be used as follows:
• The trading strategy was designed and optimized for trading cryptocurrencies only ; furthermore it works best on established high market cap cryptocurrencies that have a clear trend such as:
BTCUSD
ETHUSD
LTCUSD
XRMUSD
EOSUSD
ADAUSD
DASHUSD
ETCUSD
• The trading strategy is based on swing/position methodology. The script must therefore be used on daily timeframe candles only (1D) .
• Use USD trading pairs only (e.g. use ETHUSD instead of the ETHBTC) since the individual trend is captured more effectively and therefore gives better results.
-------------------------------------------------------------------------------------------------
The MATRIX:Ultimate Crypto Position Strategy is based on the following indicators:
• Ichimoku Cloud ; acts as the leading indicator.
• Volume ; without strong volume , a market move is not valid.
• MACD and Vortex ; both being used as confirmation indicators.
• Choppiness index ; avoids trading in choppy markets.
• Bullish/ Bearish Regular Divergences in combination with RSI to spot tops and bottoms.
• Simple and Exponential Moving Averages ; prêvents trading against the trend.
The trading strategy is easy to use, trend based and without repainting, meaning once a signal has been made it is permanent and that no future data is used in the decision making. It detects the trend and filters out market noise based on more than 10 technical indicators. ONLY when all indicators align with each other the algorithm prints a BUY or SELL signal. The trading strategy provides high probability trading signals and minimizes risk! This script aims to capture the profit from longer term trending moves and by doing so filters out non-substantial trends and avoids the associated risks with these trades.
-------------------------------------------------------------------------------------------------
The MATRIX: Ultimate Crypto Position Strategy has the following features:
• Automatically generated Buy / Sell alerts in the form of a label.
• NO Repaint once candle is closed.
• SAFEGUARD ; custom built-in security prevẹnts trading when the price is out of equilibrium.
• Customizable Display for the Ichimoku cloud indicator display.
-------------------------------------------------------------------------------------------------
Below are the backtest results. Keep in mind that this strategy is quite conservative resulting in few long positions. These results are therefore no guarantee for the future.
Back test results: (only Long trades, signal to signal, order size: 100% of equity, commision fee 0.1%, period: start of chart)
Exchange-----Asset---------Timeframe---Percent Profitable----Profit Factor-----Total Trades----Max Drawdown---Average bars in trade-----Net Profit
Coinbase-----BTC/USD---------1D----------------100----------------N/A------------------10---------------0.00---------------------54-------------------6183.6
Coinbase-----ETH/USD---------1D----------------100----------------N/A------------------7----------------0.00---------------------46-------------------11673.0
Coinbase-----LTC/USD---------1D-----------------100---------------N/A-------------------7----------------0.00---------------------46------------------4727.0
Bínance------EOS/USD---------1D-----------------100---------------N/A-------------------3----------------0.00---------------------34------------------42.8
Bínance------ADA/USD---------1D-----------------100---------------N/A-------------------2----------------0.00---------------------40------------------118.4
Coinbase-----XTZ/USD---------1D-----------------100---------------N/A-------------------1----------------0.00---------------------36------------------34.4
Bínance------BNB/USD---------1D-----------------66.7--------------10.8-------------------6---------------24.22--------------------38------------------1488.8
Bínance------ETC/USD---------1D-----------------100---------------N/A-------------------2----------------0.00---------------------33------------------94.9
Bínance------XMR/USD---------1D-----------------100---------------N/A-------------------3----------------0.00---------------------43------------------74.2
Bínance------ICX/USD----------1D-----------------100---------------N/A-------------------2----------------0.00---------------------29------------------215.3
-------------------------------------------------------------------------------------------------
Reminder: Use this trading strategy at your own risk and trade responsibly. We are not responsible for any financial loss using this strategy.
***The script is invite-only, message us to get script access***

EASYMOKU INDICATORThis is the popular Ichimoku Indicator with an easier way to adjust the settings that can help you in your trading.
Components of the Ichimoku indicator:
Tenkan Sen: Basically it is a moving average that goes from 7 to 9 periods.
Kijun Sen: Like Tenkan Sen, we are facing a moving average, but this time from 22 to 26 periods.
Chikou Span: It is the one that represents the current price, but reflected in 22 to 26 periods back.
Senkou Span A: Unlike Chikou Span, this line is drawn over the next 22 to 26 periods, and its calculation is obtained from the average between Tenkan Sen and Kijun Sen. It is a projected average in the future.
Senkou Span B: It is the result of calculating the average between the maximum and minimum over the last 44 to 52 periods, representing the following 22 to 26 periods (as well as the Senkou Span A)
As with Occidental trading systems, based on the crossings of averages, with the Ichimoku we will use the crossing of the Tenkan Sen (fast moving average) with the Kijun Sen (slow moving average) as buying and selling signals.
Strategy of this script:
A strong bullish signal is when price and Chikou Span rises above Kumo cloud and Tenkan Sen cross above Kijun Sen.
A strong bearish signal is when price and Chikou Span falls below Kumo cloud and Tenkan Sen croos under Kijun Sen.

IA2C9WThis IA2C9W indicator is the digital representation of what is called a Candlestick 9 Weeks , and is an Ichimoku Kinkohyo indicator described in volumes 3 & 4 from the original books from Hosoda, read and translated. A long 10 years story !
It was scripted for the IA2 ( Ichimoku Academy 2.0) community as members learned how to use it.
It gives some states about a cycle.
Source code is not public.

IA2NSThis IA2NS indicator is the digital representation of what is called Nakane Sen , and is an Ichimoku Kinkohyo indicator described in volumes 3 & 4 from the original books from Hosoda, read and translated. A long 10 years story !
It was scripted for the IA2 ( Ichimoku Academy 2.0) community as members learned how to use it.
Source code is not public.
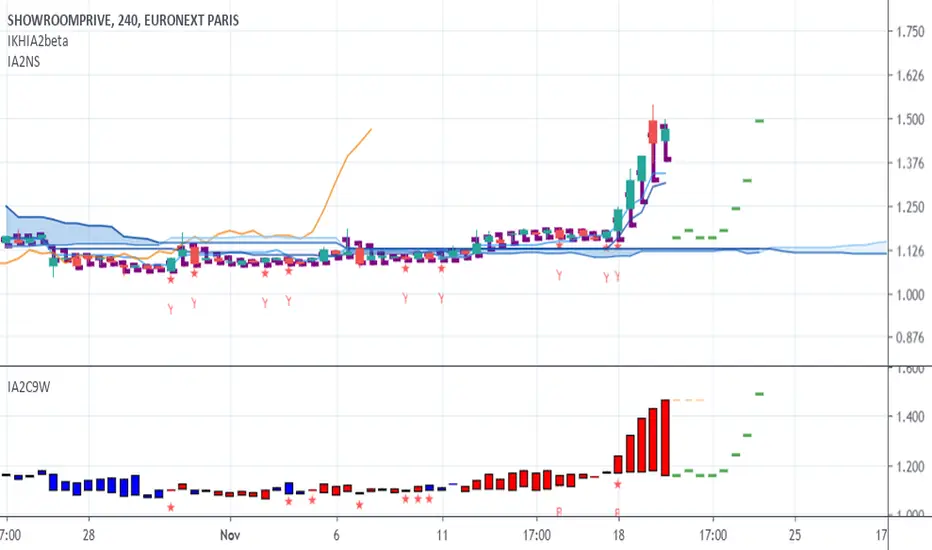
IA2NC9WThis IA2C9W indicator is the digital representation of what is called a Candlestick 9 Weeks , and is an Ichimoku Kinkohyo indicator described in volumes 3 & 4 from the original books from Hosoda, read and translated. A long 10 years story !
It was scripted for the IA2 (Ichimoku Academy 2.0) community as members learned how to use it.
It gives some states about a cycle.
Source code is not public.

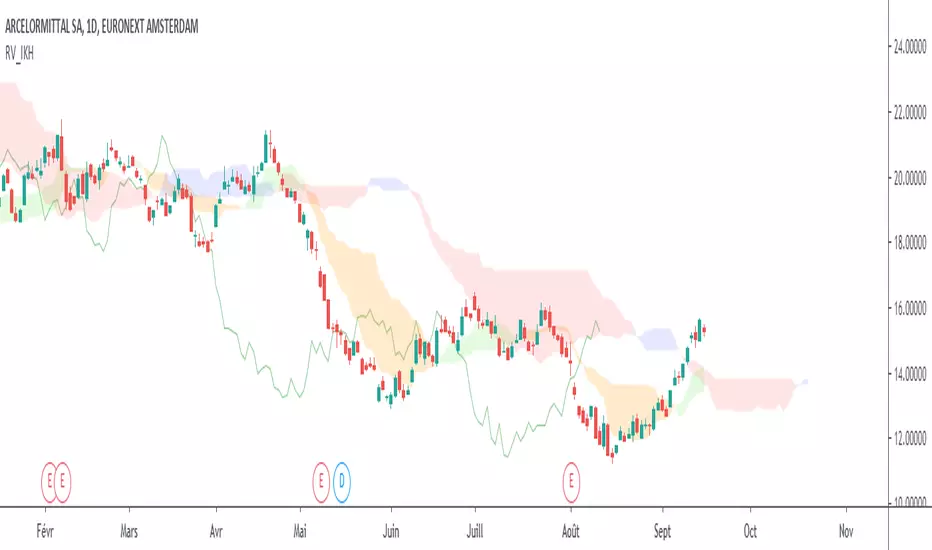
Ichimoku_RVAffichage de l'Ichimoku Kinko Hyo.
Le paramétrage permet :
- D'avoir le bon paramétrage de l'Ichimoku (décalage de 26 périodes, bougie actuelle INCLUSE)
- De coloriser ou non le Kinkohyo
- D'afficher ou non les lignes passives (projection passive du Kinkohyo et du Kumo)
- D'annuler ou non le décalage (du Kumo)
- D'afficher ou non les canaux (bornes hautes et basses de Tenkan, Kijun et de la SSB)
- De prendre ou non la bougie en cours (dans le calcul des lignes de l'Ichimoku)
- D'afficher un mini canal 3 périodes (permet d'intégrer les vagues de l'UT inférieure directement sur l'UT de travail)
Seb's Multi timeframe indicatorsHello,
This is simple combined indicator i use to have 2 same indicators on 2 timeframes
BB 1 (default for current timeframe)
BB 2 (default current timeframe x4)
4xEMA (default 9, 50, 100, 200)
Ichimoku 1 (default for current timeframe)
Ichimoku 2 (default current timeframe x4)
Gaussian Channel (base on the one of Donovan Wall)
Maybe more to come.

[astropark] Power Tools Overlay//******************************************************************************
// Power Tools Overlay
// Inner Version 1.2 20/12/2018
// Developer: iDelphi
// Developer: astropark (Ichimoku Cloud), SMA EMA & Cross tools
//------------------------------------------------------------------------------
// 21/11/2018 Added EMA SMA WMA
// 21/11/2018 Added SMA-EMA EMA-WMA WMA-SMA (Thanks to mariobros1 for the idea of the Simultaneous MA)
// 21/11/2018 Added Bollinger Bands
// 21/11/2018 Added Ichimoku Cloud (Thanks to astropark for all the code of the Ichimoku Cloud)
// 23/11/2018 Show all the indicator as default
// 23/11/2018 Added a cross when single Moving Averages crossing (Thanks to astropark for the idea)
// 24/11/2018 Descriptions Fix
// 24/11/2018 Added Option to enable/disable all Moving Averages
// 10/12/2018 Added EMAs and Crosses
//******************************************************************************

2xIchimoku Cloud + 4xMA + Williams FractalUpdated version of the previously published multi-indicator which includes
4x Moving Averages
2x Ichimoku Clouds
Bill Williams Fractals
Changes:
-Toggle switches for each indicator on input tab for easy on/off
-MA Type Selector (EMA/SMA/WMA/VWMA)
-Various default style change
Many thanks to both redwraith and jedireza for helping me work out the MA section
www.tradingview.com
www.tradingview.com
Next improvements: Ichimoku settings