supermegaduperIdea basada en indicadores
Ahora estrategia, inclui ichimoku, macd , rsi, emas y un par mas. Esta probado solo en XBTUSD
Cerca negli script per "ichimoku"

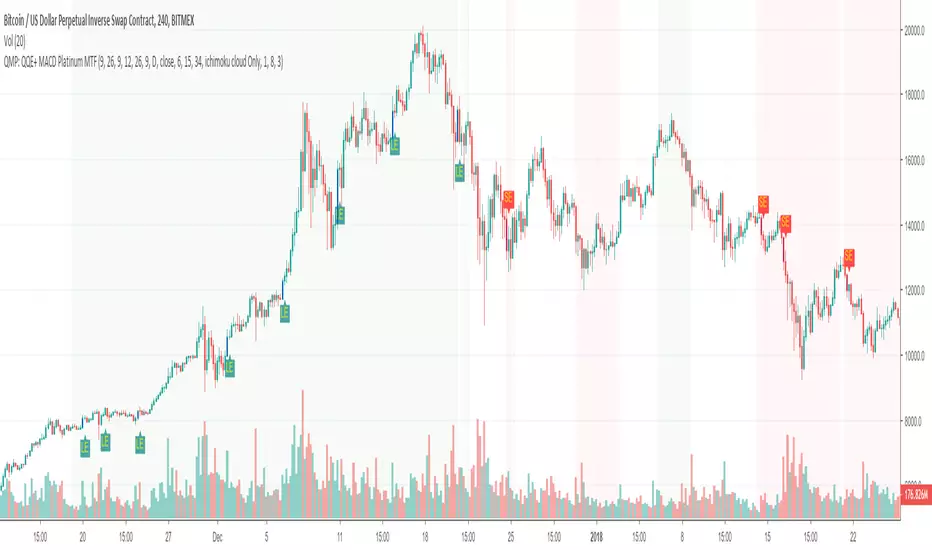
Trend following and reversal strategy for cryptoThe idea of this indicator comes from Jim Brown's book.
using the "MACD Platinum" and "QQE advanced" and multi-timeframe.
The difference to the original idea is that I use Ichimoku cloud for trend detection.
CryptologicxThis script includes the following indicators:
Bollinger Bands
SMA 5 10 20 50 100 200
EMA 14 50 55 100 200
HMA 20 / 50
Ichimoku Cloud
The MA have fixed inputs, if you wish to see different you can contact me.

Crypto Day/Swing Trade ComboI've been having some (educational) fun with Pine lately, and wanted to improve the Trading Combo script, so here is my Crypto Day/Swing Trade script.
It's a combination of several indicators, included are:
Bollinger Bands (with 3 bands/StdDev, 2 enabled by default)
(Enhanced) Ichimoku Cloud
Automatic Fibonacci S/R levels
6 Moving Averages
3 Hull Moving Averages
Price Action Bars
Price Divergence Detector
Since Pine is limited to 64 plots, this is all i could get in.
Shout out goes to ChrisMoody, Albert Callisto, 100kiwi, LazyBear, RicardoSantos & JustUncleL for their ideas and (part of) the source code
The script is fully configurable. Use the Inputs tab to enable or disable indicators and use the Styles tab to enable/disable (or configure) specific parts of each indicator.
Happy Trading!
Ichi Trend Follow SystemBased on RSI, CCI, and Ichimoku Cloud. Bars are colored according to bullish or bearish potential.


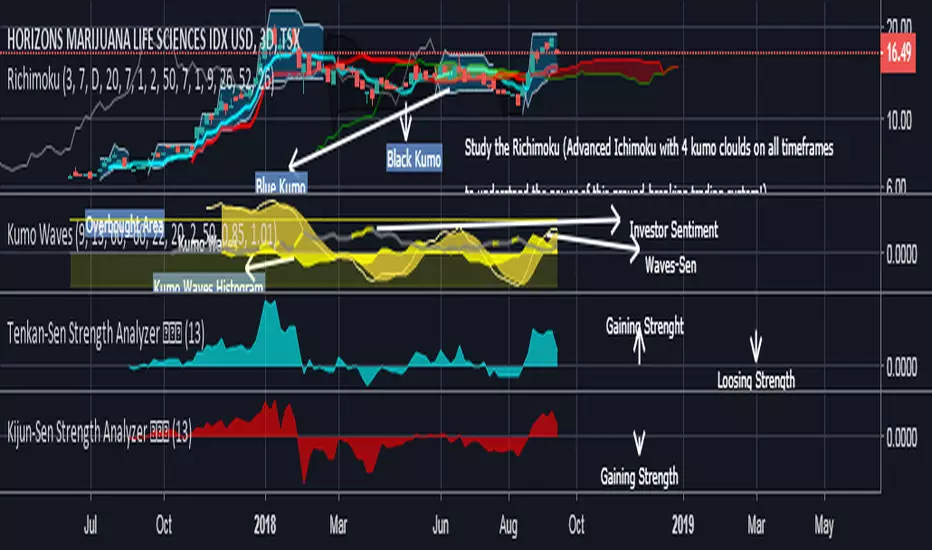
Kijun-Sen Strength Analyzer 基準線The Kijun-Sen Strength Analyzer 基準線 is included in the Richimoku Traiding System.
The Kijun-Sen Strength Analyzer (Indentify divergences. Know First. Act Faster. A must-have for every Ichimoku trader)
*As some indicators you may come across are using the repainting mode (which consists in correcting the false signal back in time).
You'll never see such thing in the Richimoku Trading System. What's on the charts is displayed in real time, no cheating...
Feel free to test the Kijun-Sen Strength Analyzer 基準線 or the Richimoku Trading System For 12 hours! Study the chart history on all timeframes. Study all details incl. divergences etc.
FAQ.
How to access the Kijun-Sen Strength Analyzer 基準線 in tradingview?
To access your indicator simply click on “Indicators” at the top of your Chart, and click on “Invite-Only Scripts”. Click on the indicator to activate it. That’s it!
Will the the Kijun-Sen Strength Analyzer 基準線 work for Stock and Index trading?
Sure! It works on all Forex, Stocks, Indexes, Metals and Crypto's!
Does this indicator work with a free TradingView Account?
Yes you can use the Kijun-Sen Strength Analyzer 基準線 or the Richimoku Indicator Trading System with a free TradingView account.
Does the indiators work on all timeframes?
Yes, the indicators can be used on all time frames!
BadaBing IchimokuUses a combination of entry parameters to define a very strict entry criterion
Uses a simple criteria to close trades
Intended for long-term trending trades

Trend jumping StrategyBased on this strategy: gaiatrader.com
When on cryptocurrencies or lower timeframes, I apply the indicator on Heiken Ashi candles to reduce noise.
If anyone's interested, I've got a RSI with a predrawed line on 50 level.

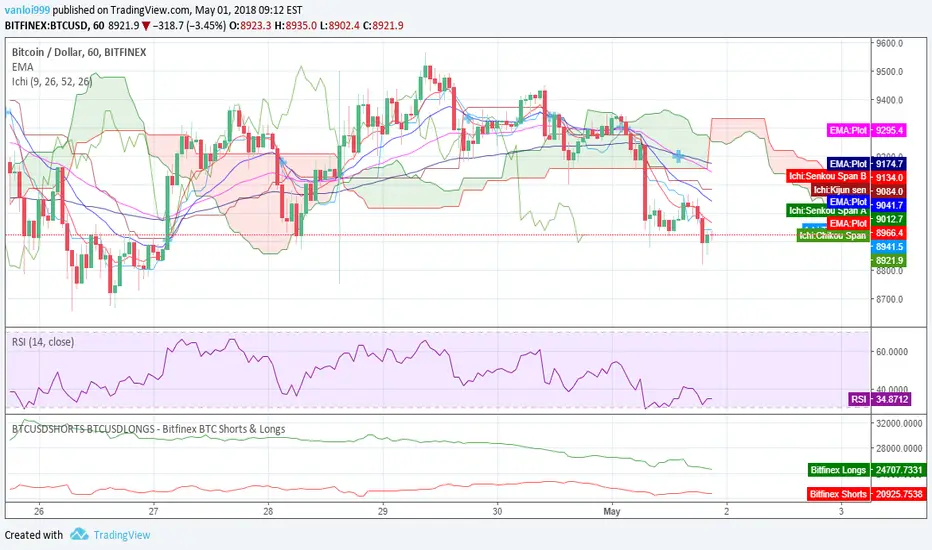
Long Term Strategy (100% BTC, only Longs)My BTCUSD Long Term Strategy,
based on Ichimoku, BB, EMA's & some William's Alligator & Fractals.
Up to this point only gave profitable long trades on BTCUSD (100% profit factor).
Have fun & be careful, nothing is bullet proof.
Ciao!

Gomoku_V2I tried to improve the one - step equilibrium table.
Since the original glance consisted of the middle line of the Hiroo band, something is calculated from the upper and lower lines.
Leading span A = Double the width of the HiLo band (Green 2) * (1-75 (≒ 76.4% return)), the central complex clouds only changed the expression at a glance.
It is unified to shift all lines at first glance by 25. The old lagging span was renamed to the preceding price span.
You can use the first line of conversion line and reference line with the combination of the preceding conversion line, the preceding reference line and the preceding price span.
The part surrounded by the preceding conversion line and the preceding reference line is defined as rain cloud.
The leading span B is the interpretation of the rain cloud and the effective value of the cloud.
(the width of the reference line and the leading span A) ÷ The width of the rain cloud is like the intensity of the cloud.
Rain clouds have the same properties as clouds, and the twisted parts are weak.
When the type of cloud and rain cloud are different, it is countervailing and resistance seems to be weak.
Even when the width of the leading span A and the leading reference line is narrow, the resistance seems to be weak.
It seems there are clouds above and below as well because it was the motivation for development so there are two clouds each above and below. The clouds are five (although it is actually six) so it is the fifth grade.
It should normally be bounced back in the green zone.
There is a red zone for abnormal price fluctuations.
It seems that the upper and lower clouds only bounce back toward the center.
If you are not satisfied with price movements overall it seems that you are in the range market, often breaking through for the passage of time.
Update Ver 2.0
integrate MTF amagumo
Devices of color arrangement
The resistance is strong where the cloud color is thin.
It should be weak as the force is canceled as much as it is black.
Batch display option for each part
Specealthanks
Ichimoku kinkou hyou
KazmaxFAN Club # Place for technical discussion
一目均衡表を改良してみました。
元の一目はハイローバンドの中線から構成されていたので、上下の線から何かを算出しています。
先行スパンA=ハイローバンドの幅の2倍(Green2)*(1-75(≒76.4%戻し)) という発見により、中央の複雑な雲は一目の表現を変えるだけにしました。
一目の線は全て25前にずらすのに統一です。旧遅行スパンは先行価格スパンに改名しました。
先行転換線と先行基準線と先行価格スパンの組み合わせで一目の転換線と基準線の使い方が出来ます。
先行転換線と先行基準線で囲まれた部分は雨雲と定義。
先行スパンBは雨雲と雲の実効値という解釈です。
(基準線と先行スパンAの幅)÷雨雲の幅が雲の強度という感じです。
雨雲も雲と同じ性質を持っていて、ねじれた部分は弱いぽいです。
雲と雨雲の種類が異なる時は打ち消しあって抵抗が弱いようです。
先行スパンAと先行基準線の幅が狭い時も抵抗が弱いようです。
上下にも雲があるように思えたのが開発の動機だったので上下に各2本雲があります。雲が5本(本当は6本ですが)だから五目です。
通常はグリーンゾーンで跳ね返されるはずです。
異常な価格変動用にレッドゾーンがあります。
上下の雲は中央に向けて跳ね返すくらいしかしないようです。
全体的に価格移動に困ればレンジ相場になって、時間の経過で強行突破することが多いように見えます。
Update Ver2.0
MTF amagumoを統合
配色を工夫
雲の色が薄い所は抵抗が強いです。
黒い所ほど力が打ち消しあって弱いはずです。
各パーツごとに一括表示オプション
Specealthanks
一目均衡表
KazmaxFAN倶楽部 #テクニカル議論の場

Candlestick Patterns With EMA and Stochastic and IchimokuEMA, Stochastic RSI, Ichinoku를 이용한 Candle Patterns 입니다.

My BTC/USDT 45min Ichimoku Strat v2Improved last version by adding a RSI derivative condition, which is very effective for spotting sheep herd moves, and follow them asap.
MASTER INDICATOR v3.0 - by CRIPTOTRADERBR. Ichimoku Clounds
. Bollinges Bands
. MA x EMA (9, 21 and 200 periods)
. SlingShotSystem
. Pivot Points

Keltner Channel + RSI + IchimokuA first try in scripting. Have taken some ideas from other places and combined into one.
Will update later with more information.

CRIPTO MIX INDICATORMix of indicators with major bug fixes.
. Bollinges Bands
. Ichimoku Clounds
. SlingShotSystem
. Pivot points
Warning: This is the fix for the last two published scripts.
Contact me to use it.

Chinkou_ProWelcome traders,
I have made this script wishing a higher gain,
Originally, this strategy is taken from Ichimoku Kinko Hyo
Simply:
ChinkouPro crossing with price is giving a clear opportunity.
Review it, master it, work it.
first version
change log
Delete function of lazy trader { smooth candle }
Delete function of alert , { make alert from chart it's better }
Enjoy with it , and contact me for any reason :)

ChinkouProWelcome traders,
I have made this script wishing a higher gain,
Originally, this strategy is taken from Ichimoku Kinko Hyo
Simply:
ChinkouPro crossing with price is giving a clear opportunity.
Review it, master it, work it.

Delmar - Ichimoku & 3-8 Trap Ribbon ConceptsDelmar - Ichimoku & 3-8 Trap Ribbon Concepts
Indicator Description
The Delmar - Ichimoku & 3-8 Trap Ribbon Concepts indicator combines the traditional Ichimoku Kinkō Hyō system with a custom 3-8 Trap Ribbon candlestick coloring scheme. This powerful tool helps traders identify trends, momentum, and potential reversal points on any TradingView chart. The Ichimoku components provide a comprehensive view of price action, while the 3-8 Trap Ribbon enhances visualization by coloring candlesticks based on their position relative to key Ichimoku lines.
Key Features
Ichimoku Kinkō Hyō: Plots five lines (Tenkan Sen, Tenkan Sen Short, Kijun Sen, Chikou Span, Senkou Span A & B) and the Kumo (cloud) to identify trends, support/resistance, and momentum.
3-8 Trap Ribbon: Colors candlesticks based on the close price’s position relative to the Tenkan Sen Short (3 periods), Tenkan Sen (9 periods), and Kijun Sen (26 periods), highlighting bullish, bearish, or neutral market conditions.
Customizable Settings: Toggle visibility of Ichimoku lines and Kumo, and adjust calculation periods to suit different timeframes or markets.
Alerts: Generates alerts when candlestick colors change, signaling potential trend shifts or trading opportunities.
How to Use the Indicator
Adding the Indicator
Open TradingView: Log in to your TradingView account and navigate to the chart for your desired asset (e.g., stock, forex, crypto).
Access Indicators: Click the “Indicators, Metrics & Strategies” button (fx icon) at the top of the chart.
Search for the Indicator: Type “Delmar - Ichimoku & 3-8 Trap Ribbon Concepts” in the search bar and select it from the list of published indicators.
Add to Chart: Click the indicator name to apply it to your chart.
Configuring Settings
Once added, customize the indicator via the Settings panel:
Ichimoku Kinkō Hyō Group:
Show Ichimoku Lines: Enable/disable the display of Tenkan Sen, Tenkan Sen Short, Kijun Sen, and Chikou Span (default: enabled).
Show Kumo: Toggle the Kumo (cloud) formed by Senkou Span A and B (default: enabled).
Tenkan Sen Length: Set the period for Tenkan Sen calculation (default: 9).
Tenkan Sen Short Length: Set the period for the short Tenkan Sen (default: 3).
Kijun Sen Length: Set the period for Kijun Sen (default: 26).
Senkou Span B Length: Set the period for Senkou Span B (default: 52).
Chikou & Senkou Offset: Adjust the offset for Chikou Span (past) and Senkou Spans (future) (default: 26).
Adjust these settings based on your trading style or timeframe (e.g., shorter periods for intraday, longer for swing trading).
Interpreting the Indicator
Ichimoku Components:
Tenkan Sen (Red): Short-term trend (default 9 periods). Above Kijun Sen = bullish, below = bearish.
Tenkan Sen Short (Light Red): Ultra-short-term trend (default 3 periods) for faster signals.
Kijun Sen (Blue): Medium-term trend (default 26 periods). Acts as dynamic support/resistance.
Chikou Span (Gray): Close price plotted 26 periods back. Above past price = bullish, below = bearish.
Kumo (Cloud): Formed by Senkou Span A and B. Green cloud = bullish (Span A > Span B), red = bearish (Span A < Span B). Price above Kumo = bullish trend, below = bearish.
3-8 Trap Ribbon (Candlestick Colors):
Dark Green: Close is above all three lines (Tenkan Sen Short, Tenkan Sen, Kijun Sen) → Strong bullish momentum.
Light Green: Close is below Tenkan Sen Short but above Tenkan Sen and Kijun Sen → Moderate bullish signal.
Yellow: Close is between Tenkan Sen and Kijun Sen → Neutral or consolidation.
Dark Red: Close is below all three lines → Strong bearish momentum.
Light Red: Close is above Tenkan Sen Short but below Tenkan Sen and Kijun Sen → Moderate bearish signal.
Gray: Default for undefined conditions.
Setting Up Alerts
The indicator includes an alert system to notify you when candlestick colors change, indicating potential trend shifts.
Open Alert Menu: Click the “Alert” button (bell icon) on the TradingView toolbar.
Select the Indicator: Choose “Delmar - Ichimoku & 3-8 Trap Ribbon Concepts” as the condition.
Configure Alert:
Set the condition to “Any alert() function call” to capture color change alerts (e.g., “Candle color changed to Dark Green”).
Choose your notification method (e.g., email, SMS, webhook, or TradingView notification).
Set the frequency to “Once Per Bar Close” to avoid multiple alerts per bar.
Create Alert: Save the alert and ensure it’s active.
Use these alerts to monitor key market shifts, such as entering/exiting a trend or spotting consolidation.
Trading Strategies
Trend Following:
Bullish: Enter long when price is above the Kumo, Chikou Span is above past price, and candles are Dark Green or Light Green.
Bearish: Enter short when price is below the Kumo, Chikou Span is below past price, and candles are Dark Red or Light Red.
Reversal Signals:
Look for Tenkan Sen crossing above/below Kijun Sen, combined with a color change (e.g., from Yellow to Dark Green for bullish reversal).
Confirm reversals when price breaks through the Kumo with a color shift (e.g., Dark Red to Yellow or Light Green).
Consolidation: Yellow candles indicate price is between Tenkan Sen and Kijun Sen, suggesting a range-bound market. Avoid trend-based trades until a breakout occurs.
Combine with other indicators (e.g., RSI, volume) for confirmation.
Tips for Optimal Use
Timeframes: Use on higher timeframes (e.g., 1H, 4H, Daily) for swing trading, or lower timeframes (e.g., 5M, 15M) for day trading.
Markets: Works well on trending markets (forex, stocks, crypto). Adjust period lengths for volatile assets.
Customization: Experiment with Tenkan Sen Short (e.g., 3–5 periods) and offset values to match market speed.
Backtesting: Test the indicator on historical data to validate signals before live trading.
Limitations
Lagging Indicators: Ichimoku components are based on historical data, so signals may lag in fast-moving markets.
False Signals: Yellow candles (consolidation) may occur frequently in choppy markets, requiring confirmation from other tools.
Performance: On low-end devices, rendering the Kumo and multiple lines may slow down if zoomed out over large datasets.
Support
For questions or suggestions, contact the indicator author via TradingView’s messaging system or check the script’s comment section for updates. Happy trading!

Enhanced Ichimoku Cloud Strategy V1 [Quant Trading]Overview
This strategy combines the powerful Ichimoku Kinko Hyo system with a 171-period Exponential Moving Average (EMA) filter to create a robust trend-following approach. The strategy is designed for traders seeking to capitalize on strong momentum moves while using the Ichimoku cloud structure to identify optimal entry and exit points.
This is a patient, low-frequency trading system that prioritizes quality over quantity. In backtesting on Solana, the strategy achieved impressive results with approximately 3600% profit over just 29 trades, demonstrating its effectiveness at capturing major trend movements rather than attempting to profit from every market fluctuation. The extended parameters and strict entry criteria are specifically optimized for Solana's price action characteristics, making it well-suited for traders who prefer fewer, higher-conviction positions over high-frequency trading approaches.
What Makes This Strategy Original
This implementation enhances the traditional Ichimoku system by:
Custom Ichimoku Parameters: Uses non-standard periods (Conversion: 7, Base: 211, Lagging Span 2: 120, Displacement: 41) optimized for different market conditions
EMA Confirmation Filter: Incorporates a 171-period EMA as an additional trend confirmation layer
State Memory System: Implements a sophisticated memory system to track buy/sell states and prevent false signals
Dual Trade Modes: Offers both traditional Ichimoku signals ("Ichi") and cloud-based signals ("Cloud")
Breakout Confirmation: Requires price to break above the 25-period high for long entries
How It Works
Core Components
Ichimoku Elements:
-Conversion Line (Tenkan-sen): 7-period Donchian midpoint
-Base Line (Kijun-sen): 211-period Donchian midpoint
-Span A (Senkou Span A): Average of Conversion and Base lines, plotted 41 periods ahead
-Span B (Senkou Span B): 120-period Donchian midpoint, plotted 41 periods ahead
-Lagging Span (Chikou Span): Current close plotted 41 periods back
EMA Filter: 171-period EMA acts as a long-term trend filter
Entry Logic (Ichi Mode - Default)
A long position is triggered when ALL conditions are met:
Cloud Bullish: Span A > Span B (41 periods ago)
Breakout Confirmation: Current close > 25-period high
Ichimoku Bullish: Conversion Line > Base Line
Trend Alignment: Current close > 171-period EMA
State Memory: No previous buy signal is still active
Exit Logic
Positions are closed when:
Ichimoku Bearish: Conversion Line < Base Line
Alternative Cloud Mode
When "Cloud" mode is selected, the strategy uses:
Entry: Span A crosses above Span B with additional cloud and EMA confirmations
Exit: Span A crosses below Span B with cloud and EMA confirmations
Default Settings Explained
Strategy Properties
Initial Capital: $1,000 (realistic for average traders)
Position Size: 100% of equity (appropriate for backtesting single-asset strategies)
Commission: 0.1% (realistic for most brokers)
Slippage: 3 ticks (accounts for realistic execution costs)
Date Range: January 1, 2018 to December 31, 2069
Key Parameters
Conversion Periods: 7 (faster than traditional 9, more responsive to price changes)
Base Periods: 211 (much longer than traditional 26, provides stronger trend confirmation)
Lagging Span 2 Periods: 120 (custom period for stronger support/resistance levels)
Displacement: 41 (projects cloud further into future than standard 26)
EMA Period: 171 (long-term trend filter, approximately 8.5 months of daily data)
How to Use This Strategy
Best Market Conditions
Trending Markets: Works best in clearly trending markets where the cloud provides strong directional bias
Medium to Long-term Timeframes: Optimized for daily charts and higher timeframes
Volatile Assets: The breakout confirmation helps filter out weak signals in choppy markets
Risk Management
The strategy uses 100% equity allocation, suitable for backtesting single strategies
Consider reducing position size when implementing with real capital
Monitor the 25-period high breakout requirement as it may delay entries in fast-moving markets
Visual Elements
Green/Red Cloud: Shows bullish/bearish cloud conditions
Yellow Line: Conversion Line (Tenkan-sen)
Blue Line: Base Line (Kijun-sen)
Orange Line: 171-period EMA trend filter
Gray Line: Lagging Span (Chikou Span)
Important Considerations
Limitations
Lagging Nature: Like all Ichimoku strategies, signals may lag significant price moves
Whipsaw Risk: Extended periods of consolidation may generate false signals
Parameter Sensitivity: Custom parameters may not work equally well across all market conditions
Backtesting Notes
Results are based on historical data and past performance does not guarantee future results
The strategy includes realistic slippage and commission costs
Default settings are optimized for backtesting and may need adjustment for live trading
Risk Disclaimer
This strategy is for educational purposes only and should not be considered financial advice. Always conduct your own analysis and risk management before implementing any trading strategy. The unique parameter combinations used may not be suitable for all market conditions or trading styles.
Customization Options
Trade Mode: Switch between "Ichi" and "Cloud" signal generation
Short Trading: Option to enable short positions (disabled by default)
Date Range: Customize backtesting period
All Ichimoku Parameters: Fully customizable for different market conditions
This enhanced Ichimoku implementation provides a structured approach to trend following while maintaining the flexibility to adapt to different trading styles and market conditions.

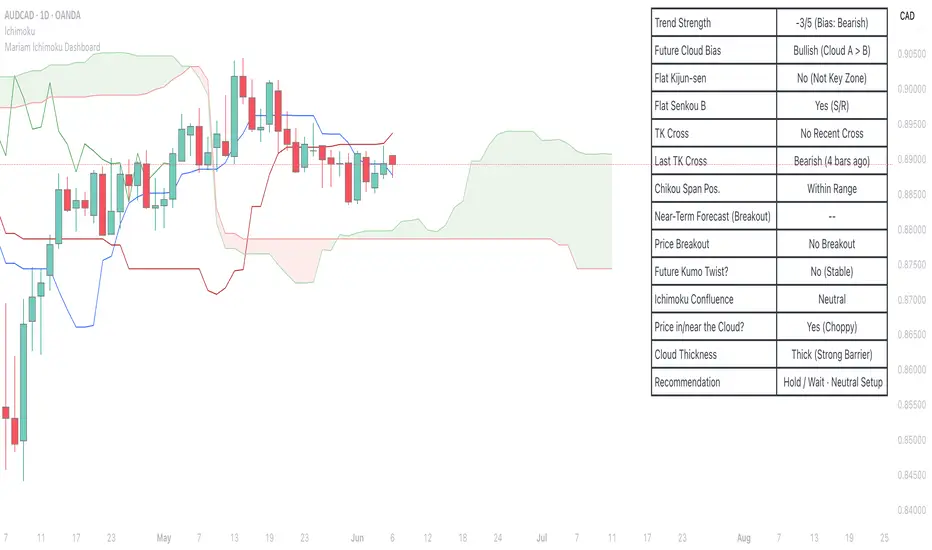
Mariam Ichimoku DashboardPurpose
The Mariam Ichimoku Dashboard is designed to simplify the Ichimoku trading system for both beginners and experienced traders. It provides a complete view of trend direction, strength, momentum, and key signals all in one compact dashboard on your chart. This tool helps traders make faster and more confident decisions without having to interpret every Ichimoku element manually.
How It Works
1. Trend Strength Score
Calculates a score from -5 to +5 based on Ichimoku components.
A high positive score means strong bullish momentum.
A low negative score shows strong bearish conditions.
A near-zero score indicates a sideways or unclear market.
2. Future Cloud Bias
Looks 26 candles ahead to determine if the future cloud is bullish or bearish.
This helps identify the longer-term directional bias of the market.
3. Flat Kijun / Flat Senkou B
Detects flat zones in the Kijun or Senkou B lines.
These flat areas act as strong support or resistance and can attract price.
4. TK Cross
Identifies Tenkan-Kijun crosses:
Bullish Cross means Tenkan crosses above Kijun
Bearish Cross means Tenkan crosses below Kijun
5. Last TK Cross Info
Shows whether the last TK cross was bullish or bearish and how many candles ago it happened.
Helps track trend development and timing.
6. Chikou Span Position
Checks if the Chikou Span is above, below, or inside past price.
Above means bullish momentum
Below means bearish momentum
Inside means mixed or indecisive
7. Near-Term Forecast (Breakout)
Warns when price is near the edge of the cloud, preparing for a potential breakout.
Useful for anticipating price moves.
8. Price Breakout
Shows if price has recently broken above or below the cloud.
This can confirm the start of a new trend.
9. Future Kumo Twist
Detects upcoming twists in the cloud, which often signal potential trend reversals.
10. Ichimoku Confluence
Measures how many key Ichimoku signals are in agreement.
The more signals align, the stronger the trend confirmation.
11. Price in or Near the Cloud
Displays if the price is inside the cloud, which often indicates low clarity or a choppy market.
12. Cloud Thickness
Shows whether the cloud is thin or thick.
Thick clouds provide stronger support or resistance.
Thin clouds may allow easier breakouts.
13. Recommendation
Gives a simple trading suggestion based on all major signals.
Strong Buy, Strong Sell, or Hold.
Helps simplify decision-making at a glance.
Features
All major Ichimoku signals summarized in one panel
Real-time trend strength scoring
Detects flat zones, crosses, cloud twists, and breakouts
Visual alerts for trend alignment and signal confluence
Compact, clean design
Built with simplicity in mind for beginner traders
Tips
Best used on 15-minute to 1-hour charts for short-term trading
Avoid entering trades when price is inside the cloud because the market is often indecisive
Wait for alignment between trend score, TK cross, cloud bias, and confluence
Use the dashboard to support your trading strategy, not replace it
Enable alerts for major confluence or upcoming Kumo twists