Ichimoku HorizonIchimoku Horizon – Multi-Timeframe Analysis
A multi-timeframe Ichimoku faithful to Hosoda, with authentic real-time calculations.
Ichimoku Horizon is an indicator based on the original method developed by Goichi Hosoda in the 1930s. It strictly respects the authentic formulas and prioritizes mathematical fidelity.
Key Features
Intelligent Multi-Timeframe
Native chart: Ichimoku from your trading timeframe
3 higher timeframes: Daily (1D), Weekly (1W), Monthly (1M) by default
Automatic projection: only higher timeframes relative to the chart are displayed
Precise offsets: displacement adapted to each timeframe
Guaranteed Authenticity
Hosoda’s original formulas fully respected
lookahead_off exclusively: lines calculated in real time with the current candle
Traditional displacement: 26 periods for cloud projection and Chikou shift
Why lookahead_off?
lookahead_off is the calculation mode that respects Hosoda’s logic:
Tenkan, Kijun, SSA and SSB all include the current candle and move in real time.
Chikou is the only exception: shifted 26 periods but calculated only with confirmed closes.
This way, what you see always matches the actual market as it is forming.
What is the no repaint approach?
A no repaint indicator displays values exactly as they exist in the present moment:
Lines update in real time during the formation of a candle.
Once the candle closes, they remain permanently fixed.
This ensures that the plots reflect the true construction of the market.
Main Parameters
Tenkan: 9 periods (short term)
Kijun: 26 periods (medium term)
SSB: 52 periods (long term)
Displacement: 26 periods (+26 for the cloud, −26 for the Chikou)
Timeframe Selection
TF1: Daily (structure aligned with trading activity)
TF2: Weekly (intermediate trend)
TF3: Monthly (macro vision)
Example Configurations
Scalping: Chart 1m → TF1: 5m, TF2: 15m, TF3: 1H
Intraday: Chart 5m → TF1: 15m, TF2: 1H, TF3: 4H
The indicator automatically hides inconsistent timeframes (lower than the chart).
Natural Line Display
Some lines will sometimes appear flat or straight: this is the normal behavior of Ichimoku, directly reflecting the highs and lows of their calculation windows.
Conclusion
Ichimoku Horizon is designed to remain true to Hosoda’s vision while offering the clarity of a modern multi-timeframe tool.
It delivers authentic, real-time calculations with no compromise.
Cerca negli script per "ichimoku"

Options Series - Supertrend, HalfTrend, Ichimoku Cloud and P_SAR➤ Supertrend:
➤ HalfTrend:
➤ Ichimoku Cloud:
➤ Parabolic SAR:
⭐ Overview and How It Works:
This script combines multiple popular technical indicators—Supertrend, HalfTrend, Ichimoku Cloud, and Parabolic SAR—into a single, cohesive tool for analyzing price trends and reversals. Designed for traders who prefer multi-layered confirmation, it displays non-overlay signals in a candlestick format, helping users make sense of intricate market dynamics. It also includes a "Master Candle" condition, which aggregates the signals from all indicators, providing a powerful snapshot of market sentiment.
References for study,
Supertrend and HalfTrend and Ichimoku Cloud and Parabolic SAR
⭐ Key Features and Functionality:
The script integrates four indicators and visually represents them in a non-overlay fashion, meaning that each indicator's signal appears on separate candlestick layers. It uses color coding to differentiate between bullish and bearish signals. The Master Candle is a unique feature that aggregates the signals from all indicators to show the overall sentiment.
Supertrend: It uses ATR and a multiplier factor to create a trailing stop, identifying bullish and bearish trends.
HalfTrend: It analyzes market volatility that provides buy and sell signals based on volatility channels and historical highs and lows.
Ichimoku Cloud: It leverages historical highs and lows to form the conversion and baseline, which are compared to assess market strength.
Parabolic SAR: A stop-and-reverse system that highlights potential reversals. It is based on time and price, offering traders potential reversal points.
Master Candle: It computes a score based on the confluence of all four indicators, adding another layer of confirmation.
🎨 Visualizations and User Experience:
The script's user interface is highly visual, with color-coded candlesticks plotted across multiple layers. Each indicator has its own color coding for bullish and bearish signals, ensuring clarity:
➤ Green for bullish signals.
➤ Red for bearish signals.
➤ Each candlestick layer represents a different indicator (e.g., Supertrend, HalfTrend, etc.), making it easy for the trader to isolate and interpret signals.
➤ The "Master Candle" provides an overarching view of the market by displaying a consolidated signal, which can reduce confusion from mixed indicator signals.
⭐ Settings and Customization:
The script is highly customizable, allowing users to adjust the settings for each indicator. Key customizable parameters include:
• Supertrend ATR Period and Factor
• HalfTrend Amplitude and Channel Deviation
• Ichimoku Conversion, Base, and Lagging Span Periods
• Parabolic SAR Start, Increment, and Maximum value
Additionally, users can toggle the visibility of each indicator and customize the look of the plot to suit their preferences.
⭐ Uniqueness of the Concept:
No repaints. This is the advanced representation and the combination of multiple indicators into a single script, along with a powerful "Master Candle" that aggregates them, makes this tool unique. Most scripts provide isolated indicator signals, while this one brings together four powerful indicators and visually simplifies the analysis. The non-overlay style and color-coded candlesticks offer traders an easy-to-understand, actionable visual cue, which stands out from traditional indicator overlays.
🚀 Conclusion:
This script is a comprehensive, multi-indicator trading tool suitable for traders looking for reliable trend-following and reversal detection. Its ability to provide an aggregated "Master Candle" signal reduces noise and aids in better decision-making. Customization options allow users to tailor it to their trading style, while its clear visualizations provide an excellent user experience.

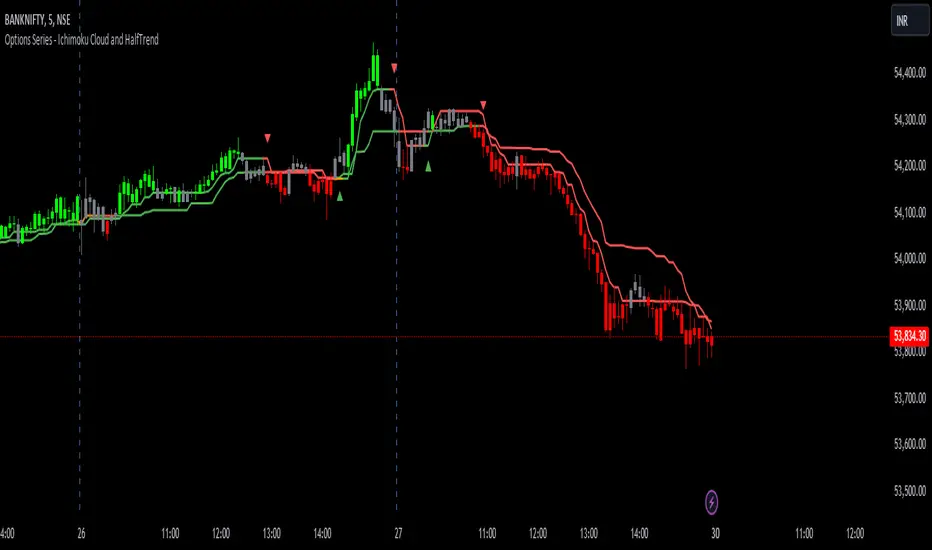
Options Series - Ichimoku Cloud and HalfTrend
The provided script combines two powerful technical indicators, Ichimoku Cloud and HalfTrend, to create a hybrid trading tool. Here's an analysis of the key components and how they work together:
Ichimoku Cloud and HalfTrend
⭐ 1. Indicator Title and Settings:
The script sets the title as "Options Series - Ichimoku Cloud and HalfTrend" and uses the overlay=true option to display the indicators directly on the price chart.
⭐ 2. Color Definitions:
Several colors are defined for later use:
Green and Red for different types of candles and signals.
Fluorescent Colors for highlighting significant trends or changes in market conditions.
⭐ 3. Ichimoku Cloud Setup:
The Ichimoku Cloud is a comprehensive indicator used to identify support, resistance, and trend direction. Here’s how the script configures it:
Conversion Periods, Base Periods, Lagging Span 2 Periods, and Displacement are customizable via input options, giving flexibility to adjust Ichimoku settings based on different market conditions.
The function donchian(len) calculates the Donchian Channel average, which is used to define the Conversion Line and Base Line. The crossover of these lines is crucial in determining bullish or bearish trends.
Color Logic for Kijun Cross: If the Conversion Line is above the Base Line, the trend is bullish (green color), while a bearish trend is indicated by red. A neutral condition is marked with orange.
⭐ 4. HalfTrend Indicator Setup:
The HalfTrend indicator detects trend reversals based on high/low price deviations from a moving average:
Amplitude and Channel Deviation inputs allow users to control the sensitivity of the indicator.
showArrows and showChannels toggle the display of buy/sell arrows and trend channels.
maxLowPrice and minHighPrice variables are initialized to track significant high/low points during the trend, used to confirm trend reversals.
⭐ 5. ATR and Trend Calculations:
The Average True Range (ATR) is used to calculate the volatility-based channels. The script calculates atr2 and uses this to create atrHigh and atrLow for plotting the channel.
The trend detection logic is as follows:
When the trend is upward, the script seeks confirmation by comparing the high moving average with previous lows, signaling a continuation of the uptrend if it holds.
Conversely, a downtrend is confirmed when the low moving average exceeds previous highs.
⭐ 6. Customized Candle Coloring:
A custom color scheme is applied to candles based on a combination of trend direction and Ichimoku Cloud signals:
GreenFluorescent for strong bullish conditions where price is above the HalfTrend line, and the Conversion Line is above the Base Line.
RedFluorescent for strong bearish conditions, with price below the HalfTrend line and Conversion Line below the Base Line.
Gray for neutral or indecisive conditions.
⭐ 7. Plots and Shapes:
The script plots various elements:
HalfTrend Line: The main trendline is plotted in either green (buy) or red (sell), with adjustable line width.
Ichimoku Base Line: This is plotted with the dynamic color based on crossovers.
Buy/Sell Arrows: These are drawn on the chart when valid buy/sell conditions are met.
Custom Candles: The script overrides default chart candles with custom-colored candles based on the previously discussed logic.
⭐ 8. Improvements:
Optimization: Parameters like the amplitude, channel deviation, and Ichimoku periods can be fine-tuned based on backtesting results to maximize performance for specific assets or timeframes.
Alerts: The script could be enhanced by adding alert conditions for real-time buy/sell notifications, leveraging alertcondition() in Pine Script.
In summary, this script merges two trend-following techniques for a multi-faceted view of the market, using visual cues and trendline logic to provide a robust trading tool.
🚀 Conclusion:
Trend-Following System: The combination of Ichimoku Cloud and HalfTrend provides a comprehensive view of both long-term trends (via Ichimoku) and shorter-term reversals (via HalfTrend).
Visual Signals: The script includes clear visual signals (arrows and custom-colored candles) to help traders quickly spot buy/sell opportunities.
Dynamic Customization: Through user inputs, this indicator can be tailored to different market conditions, making it versatile.
Ichimoku Clouds Strategy Long and ShortOverview:
The Ichimoku Clouds Strategy leverages the Ichimoku Kinko Hyo technique to offer traders a range of innovative features, enhancing market analysis and trading efficiency. This strategy is distinct in its combination of standard methodology and advanced customization, making it suitable for both novice and experienced traders.
Unique Features:
Enhanced Interpretation: The strategy introduces weak, neutral, and strong bullish/bearish signals, enabling detailed interpretation of the Ichimoku cloud and direct chart plotting.
Configurable Trading Periods: Users can tailor the strategy to specific market windows, adapting to different market conditions.
Dual Trading Modes: Long and Short modes are available, allowing alignment with market trends.
Flexible Risk Management: Offers three styles in each mode, combining fixed risk management with dynamic indicator states for versatile trade management.
Indicator Line Plotting: Enables plotting of Ichimoku indicator lines on the chart for visual decision-making support.
Methodology:
The strategy utilizes the standard Ichimoku Kinko Hyo model, interpreting indicator values with settings adjustable through a user-friendly menu. This approach is enhanced by TradingView's built-in strategy tester for customization and market selection.
Risk Management:
Our approach to risk management is dynamic and indicator-centric. With data from the last year, we focus on dynamic indicator states interpretations to mitigate manual setting causing human factor biases. Users still have the option to set a fixed stop loss and/or take profit per position using the corresponding parameters in settings, aligning with their risk tolerance.
Backtest Results:
Operating window: Date range of backtests is 2023.01.01 - 2024.01.04. It is chosen to let the strategy to close all opened positions.
Commission and Slippage: Includes a standard Binance commission of 0.1% and accounts for possible slippage over 5 ticks.
Maximum Single Position Loss: -6.29%
Maximum Single Profit: 22.32%
Net Profit: +10 901.95 USDT (+109.02%)
Total Trades: 119 (51.26% profitability)
Profit Factor: 1.775
Maximum Accumulated Loss: 4 185.37 USDT (-22.87%)
Average Profit per Trade: 91.67 USDT (+0.7%)
Average Trade Duration: 56 hours
These results are obtained with realistic parameters representing trading conditions observed at major exchanges such as Binance and with realistic trading portfolio usage parameters. Backtest is calculated using deep backtest option in TradingView built-in strategy tester
How to Use:
Add the script to favorites for easy access.
Apply to the desired chart and timeframe (optimal performance observed on the 1H chart, ForEx or cryptocurrency top-10 coins with quote asset USDT).
Configure settings using the dropdown choice list in the built-in menu.
Set up alerts to automate strategy positions through web hook with the text: {{strategy.order.alert_message}}
Disclaimer:
Educational and informational tool reflecting Skyrex commitment to informed trading. Past performance does not guarantee future results. Test strategies in a simulated environment before live implementation

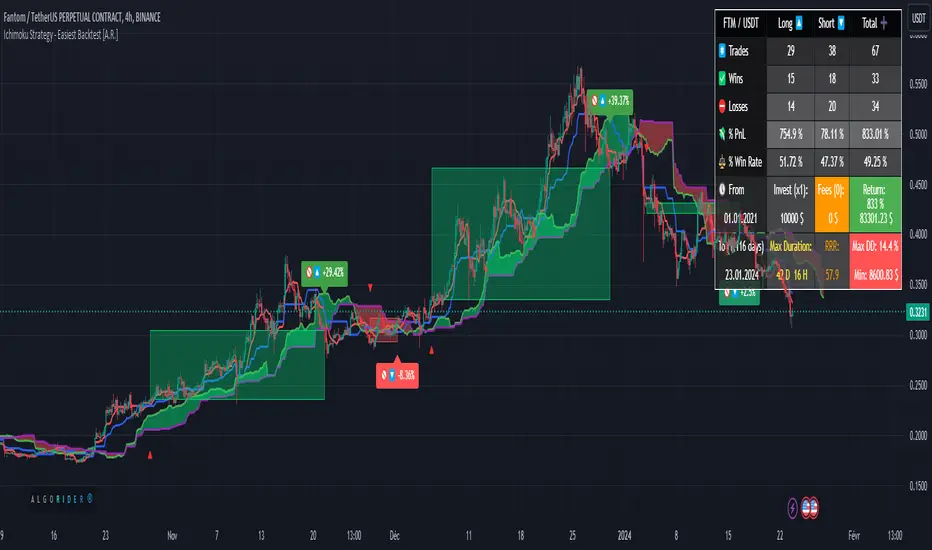
Ichimoku Strategy - Easiest Backtest [A.R.]▓ INTRODUCTION
This indicator allows a new "sandbox" approach to the Ichimoku system allowing to combine several entry, confirmation and exit conditions, to add basic risk management, to be able to backtest the performance of the strategy using a table directly on chart, and automate entry and exit signals using alerts.
▓ DEFINITION
The Ichimoku strategy is a trading system based on technical analysis, using a set of graphical indicators to evaluate the trend, strength and support/resistance levels of a financial asset. It integrates components such as the conversion line (Tenkan), the baseline (Kijun), the cloud delimited by the Senkou Span A and the Senkou Span B (SSA - SSB - Kumo) and the lagging span (Chikou) to provide different trading signals.
▓ ADDED VALUE
Several indicators and strategies concerning Ichimoku are already available on Tradingview, we are publishing this indicator to make this strategy even more accessible, what makes it original:
▪️ Unique Settings Windows, easy-to-read. The settings categories are clearly separated. Some parameters are aligned to avoid having an endless list of parameters to modify. This makes the settings window easy to understand and pleasant to use.
▪️ Sandbox type settings, you can choose 1 or 2 Entry conditions, choose to add 1 Confirmation, choose to add between 1 and 3 Exit Conditions. Dozens of possible configurations.
▪️ Possibility of adding basic Risk Management (TP/SL)
▪️ Backtest table directly on chart that allow to get quickly the results (script execution <1 sec) which makes it practical, allowing dozens of different configurations to be tested in a short period of time
▪️ Monitoring historical and current trades on chart thanks to Boxes and Labels
▓ HOW TO USE
You can try the indicator with default settings but you can also modify backtesting settings and trade Entry conditions, Entry Confirmation, and Exit conditions, also you can decide to add a Stop Loss and/or a Take Profit. Then you can find the stats of the backtesting in a table directly in the top right corner of the chart. Finally you can automate the strategy using Alert conditions. You can find all the settings below:
Initial backtesting settings:
🔹Set up Side: Choose Long|Short, Long or Short
🔹Set up Investment: Choose an amount in $, it simulates the equity / funds on the trading account.
🔹Set up Position Size: Choose an amount in $, it simulates the amount of the position size of each trade. If you want to simulate leverage trading, you can put a Position Size superior to Investment. For exemple Investment = 10000 and Position Size = 20000 simulates a x2 leverage.
🔹Set up your Fee rate %: Each trade entry and trade exit, a % of position size will be deducted from the PnL stats. For example if you choose 0.04% with 10000 Position Size, 4$ will be deducted each trade entry and each trade exit = 8$ fees each trade.
🔹Set up the Start and End date: It allows to backtest the strategy over a period of time, for Example from 01-01-2021 to 01-12-2022. By default the end date is year 2050, the backtest will start to take into account data from Start Date to the current time.
Backtest the main Ichimoku sub-strategies choosing entry conditions:
🔸Cloud Breakouts trading: Choose this Entry condition to start a trade when Price crosses the Cloud Upside (Long) or Downside (Short)
🔸Tenkan x Kijun cross trading: Choose this Entry condition to start a trade when Tenkan (Red line) crosses Kijun (Blue line) Upside (Long) or Downside (Short)
* There is no repaint, a signal is validated after the condition is confirmed at the end of the previous candle. If a signal appears on the chart, it won't ever disappear.
Entry Confirmations:
✔️ Chikou Above or Below price: if you check this setting, Long entry signals will be confirmed only when the Chikou (White Line) is Above the current price and Short entry signals will be confirmed only when the Chikou (White Line) is below the current price. In the Ichimoku system the Chikou is often used to confirm all types of signals.
Exit Conditions:
❌ Cloud Reintegrations: When a trade is open (Long or Short), if the price goes back into the cloud the trade is closed
❌ Reverse Cloud Breakouts: When a Long trade is open, if the price breaks out of the cloud from below the trade is closed. When a Short trade is open, if the price breaks out of the cloud from above the trade is closed.
❌ Reverse Tenkan-Kijun Cross: When a Long trade is open, if the Tenkan crosses Downside the Kijun the trade is closed. When a Short trade is open, if the Tenkan crosses Upside the Kijun the trade is closed.
Basic Risk Management:
⛔️ SL: Choose to set up a Stop Loss
✅ 1 single TP: Choose to set up a Take Profit
Signals:
🔔 Entry/Exit Alerts available: 4 types of alert conditions are available ENTRY LONG, ENTRY SHORT, EXIT LONG, EXIT SHORT. The entry conditions trigger at the beginning of the candle, choose alert frequence = once per bar.
👉 Tips: Easier to find profitable configurations in High Timeframe above H4.
▓ BACKTESTING SYSTEM
The Backtesting system integrated into the script tracks each trade. It allows you to test the strategy over a fixed period between a start date and an end date. It also allows to quickly and directly display on the chart the most important data to determine if a configuration is profitable such as the % PnL, the Max Drawdown, the amount of fees, the risk-reward ratio. It has been designed to be easy and quick to use even for a beginner.
═════════════════════════════════════════════════════════════════════════
The information published here on TradingView is not prohibited, doesn't constitute investment advice, and isn't created solely for qualified investors.
Important to note: The source code of this indicator is not accessible because it benefits from the code of our backtesting system present in other non-public indicators that we protect. Our indicators with the same backtesting system are published in separate publications because putting them together in a single script would considerably slow down the execution of the script.
Ichimoku Analysis Tool by TheSocialCryptoClubName: Ichimoku Analysis Tool
Category: Indicator.
Timeframe: Any Timeframe
Description: Ichimoku Analysis Tool is an assistant for the trader to visualize the information that can be perceived at a glance from the Ichimoku Kinko Hyo indicator.
Suggested usage: Use on Daily to evaluate the general long term, short term and mid term situation.
Technical Details: Each cell of the table describes an element of the Ichimoku by simply assessing the direction of the lines - or whether they are flat - and how they are positioned with each other (e.g. Tenkan above or below the Kijun) and in general how long ago the last Kumo Twist was and the width in percent of the Kumo.
Credits:
- Some of the indications has been explained by Corrado Rondelli
- Table has been inspired by tanayroy's ICHIMOKU Trading beta

Ichimoku Kinko Hyo + FractalsIn contrast to my Ichimoku ++ Study this is a pure Ichimoku Konko Hyo Study with Bill Williams Fractals (I couldn't leave out the fractals as these levels are too important for Ichimoku trading).
In this study you can find many visualisation options for the Ichimoku Indicator and the signals the Ichimoku Tradingsystem can provide.
Tenkan-sen and Kijun-sen are provided optionally as mtf levels.
An mtf price cloud relationship is shown in the upper right.
The included signals are:
B1/S1 is a strong filtered signal. The condition for long entry is:
price > Kumo AND Chikou > price AND Chikou > Kumo AND Tenkan > Kijun AND Komo is green
B2/S2 is a less filtered signal. The condition for long entry is:
price > Kumo AND Chikou > price AND Tenkan > Kijun
IB/IS is a confluence signal. The condition for a long/short entry is: more than 50% of the 8 defined conditions must trigger a long signal. Below 50% long, it is a short signal because more than 50% of the entry conditions have triggered a short signal.
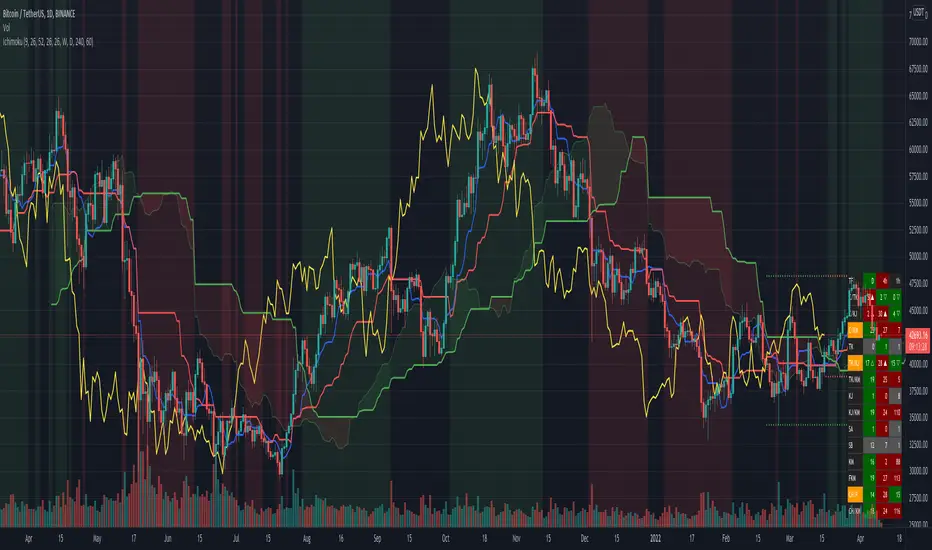
Ichimoku Score by KingThiesiScore, is an Ichimoku-based scoring system, in which individual Ichimoku events are measured by their impact, and then counted towards a greater score, leaning either bullish or bearish. The score tends to be between -3 and 3 for 99% of occurrences. Scores above or below this range are abnormal to say the least.
How the Score is Calculated
Bearish events are negative points. When the score is below zero, bears have control of the given TF. In theory, when the iScore is falling, the market is in downtrend. Note the divergences on reversals. iScore tends to lead price.
Bullish events are positive points. When the score is above zero, bulls have control of the given TF. In theory, when the iScore is rising, the market is in uptrend. Note the divergences on reversals. iScore tends to lead price.
Bullish Events Measured: TK Bull Cross, PK Bull Cross, Lagline Bull Cross, and Leadline Bull Cross
Bearish Events Measured: TK Bear Cross, PK Bear Cross, Lagline Bear Cross & LeadLine Bear Cross
The location of the events are also a factor in the scoring system. Locations include above the kumo, inside the kumo, and below the kumo, and are then prioritized in their own respects, based on the standard rules interpretation of Ichimoku signals, which users can read more into if interested. Links are provided below with further reading.
iScore can be applied to any ticker by any trader, and is not limited to any specific TF. Its programmed in Pine version 4 and uses Heikin Ashi inputs for OHLC, although traders are able to use with any chart type.
Links for Further Reading
Fidelity Ichimoku Summary
Investopedia Intro to Ichimoku Clouds
Cheers!
KT

Ichimoku Cloud & CandlesThe Ichimoku Cloud is a hybrid indicator combining numerous technical indicators that show support and resistance levels, as well as indicating momentum and trend direction. Ichimoku does so by taking multiple, pre-set price moving averages and plotting them on the chart in line form. It also uses these inputs to create a "cloud" which intends to forecast where the price may find support or resistance in the future. Refer to standard, and widely available, Ichimoku Cloud technical publications and/or YT videos for information on how to trade using the Ichimoku Cloud.
This indicator uses standard/default Ichimoku settings. The difference between this indicator and standard Ichimoku indicators is that the candle colors are based on price relative to the Tenkan-sen and Kijun-sen, and as such are painted lime, fuchsia and gray. Lime price candles indicate that price is in an uptrend; fuchsia candles indicate a downtrend; gray is no identifiable trend, or neutral.

ICHIMOKU Kinko Hyo by KIVANC fr3762Created in 1940's by Goichi Hosoda withe the help of University students in Japan.
Ichimoku is one of the best trend following indicators that works nearly perfect in all markets and time frames.
Ichimoku is originally an built in indicator in Tradingview but there are some problems like:
the indicator hast 5 lines but you can change only 4 parameters in the settings menu of Tradingview Charts which you could only control 3 of the lines effectively. A second problem is that Tradingview preferred to use English titles for the ICHIMOKU lines instead of giving them the most common original Japanese ones. (So I rewrite the indicator)
Kijun Sen (blue line): Also called standard line or base line, this is calculated by averaging the highest high and the lowest low for the past 26 periods.
Tenkan Sen (red line): This is also known as the turning line and is derived by averaging the highest high and the lowest low for the past nine periods.
Chikou Span (Plum line): This is called the lagging line. It is today’s closing price plotted 26 periods behind.
Senkou SpanA (green line): The first Senkou line is calculated by averaging the Tenkan Sen and the Kijun Sen and plotted 26 periods ahead.
Senkou SpanB (purple line):
The second Senkou line is determined by averaging the highest high and the lowest low for the past 52 periods and plotted 26 periods ahead.
PERSONALLY I ADVISE YOU TO USE ICHIMOKU WITH DEAFULT LENGTHS (9,26,26,52,26) IN ORDER FOR STOCK MARKETS AND FOREX MARKETS
FOR CRYPTO YOU'D BETTER USE:
10,30,30,60,30 OR 20,60,60,120,60
THE TRICKY THING IS THAT KEEPING THE 1-3-3-6-3 RATIO CONSTANT IS NECESSARY
Here's a link of my Youtube video explaining ICHIMOKU but unfortunately only in TURKISH:
www.youtube.com
Developed by: Goichi Hosoda

Ichimoku Cloud w/ HelpersIchimoku Cloud w/ Helpers is your standard Ichimoku Cloud indicator with two additions.
Checkout TradingView's write up on the Ichimoku Cloud here .
The two additions added to this indicator are described below:
1 — A box is drawn centered on the current bar and stretching a length equal to the 'Senkou Span B Period'.
• The box encompasses the highest high and lowest low in that period.
2 — Two new lines are added.
• Green Line : Projection from the Lagging Line (Chikou Span) to the Span A line, indicating historical price action relative to future projected support/resistance.
• Red Line : Projection from the Kijun-sen (Base Line) to the Span B line, indicating medium-term trend direction relative to future projected support/resistance.
Use cases :
• The Box is simply a visual cue to draw your eye towards the area that the Ichimoku Cloud is currently attempting to analyze: Past, Present and Future.
• The green and red lines add a way to interpret the sentiment:
• Diverging Lines with Green Above Red --> Interpret as Bullish Sentiment
• Converging Lines with Green Crossing Above Red --> Interpret as Bullish reversal or strengthening
• Converging Lines with Green Crossing Below Red --> Interpret as Bearish reversal or weakening.
• Diverging Lines with Red Above Green --> Interpret as Bearish Sentiment
• Converging Lines with Red Crossing Below Green --> Interpret as Bullish reversal or weakening bearish trend.
Current limitations :
• Under settings -> Styles, the plotted lines don't allow the colors to be changed. A bug I'm trying to figure out.
Bugs?
Kindly report any issues you run into and I'll try to fix them promptly.
Thank you!

Ichimoku Cloud and Bollinger Bands (by Coinrule)The Ichimoku Cloud is a collection of technical indicators that show support and resistance levels, as well as momentum and trend direction. It does this by taking multiple averages and plotting them on a chart. It also uses these figures to compute a “cloud” that attempts to forecast where the price may find support or resistance in the future.
The Ichimoku Cloud was developed by Goichi Hosoda, a Japanese journalist, and published in the late 1960s. It provides more data points than the standard candlestick chart. While it seems complicated at first glance, those familiar with how to read the charts often find it easy to understand with well-defined trading signals.
The Ichimoku Cloud is composed of five lines or calculations, two of which comprise a cloud where the difference between the two lines is shaded in.
The lines include a nine-period average, a 26-period average, an average of those two averages, a 52-period average, and a lagging closing price line.
The cloud is a key part of the indicator. When the price is below the cloud, the trend is down. When the price is above the cloud, the trend is up.
The above trend signals are strengthened if the cloud is moving in the same direction as the price. For example, during an uptrend, the top of the cloud is moving up, or during a downtrend, the bottom of the cloud is moving down.
The Bollinger Bands are among the most famous and widely used indicators. A Bollinger Band is a technical analysis tool defined by a set of trendlines plotted two standard deviations (positively and negatively) away from a simple moving average ( SMA ) of a security's price, but which can be adjusted to user preferences. They can suggest when an asset is oversold or overbought in the short term, thus providing the best time for buying and selling it.
This strategy combines the Ichimoku Cloud with Bollinger Bands to better enter trades.
Long orders are placed when these basic signals are triggered.
Long Position:
Tenkan-Sen is above the Kijun-Sen
Chikou-Span is above the close of 26 bars ago
Close is above the Kumo Cloud
The closing price is greater than the upper standard deviation of the Bollinger Bands
Short Position:
Tenkan-Sen is below the Kijun-Sen
Chikou-Span is below the close of 26 bars ago
Close is below the Kumo Cloud
The upper standard deviation of the Bollinger Band is greater than the closing price
The script is backtested from 1 January 2022 and provides good returns.
The strategy assumes each order is using 30% of the available coins to make the results more realistic and to simulate you only ran this strategy on 30% of your holdings. A trading fee of 0.1% is also taken into account and is aligned to the base fee applied on Binance.
This script also works well on BTC 30m/1h, ETH 2h, MATIC 2h/30m, AVAX 1h/2h, SOL 45m timeframes

Ichimoku Cloud with MACD (By Coinrule)The Ichimoku Cloud is a collection of technical indicators that show support and resistance levels, as well as momentum and trend direction. It does this by taking multiple averages and plotting them on a chart. It also uses these figures to compute a “cloud” that attempts to forecast where the price may find support or resistance in the future.
The Ichimoku Cloud was developed by Goichi Hosoda, a Japanese journalist, and published in the late 1960s. It provides more data points than the standard candlestick chart. While it seems complicated at first glance, those familiar with how to read the charts often find it easy to understand with well-defined trading signals.
The Ichimoku Cloud is composed of five lines or calculations, two of which comprise a cloud where the difference between the two lines is shaded in.
The lines include a nine-period average, a 26-period average, an average of those two averages, a 52-period average, and a lagging closing price line.
The cloud is a key part of the indicator. When the price is below the cloud, the trend is down. When the price is above the cloud, the trend is up.
The above trend signals are strengthened if the cloud is moving in the same direction as the price. For example, during an uptrend, the top of the cloud is moving up, or during a downtrend, the bottom of the cloud is moving down.
The MACD is a trend following momentum indicator and provides identification of short-term trend direction. In this variation it utilises the 12-period as the fast and 26-period as the slow length EMAs, with signal smoothing set at 9.
This strategy combines the Ichimoku Cloud with the MACD indicator to better enter trades.
Long/Short orders are placed when three basic signals are triggered.
Long Position:
Tenkan-Sen is above the Kijun-Sen
Chikou-Span is above the close of 26 bars ago
Close is above the Kumo Cloud
MACD line crosses over the signal line
Short Position:
Tenkan-Sen is below the Kijun-Sen
Chikou-Span is below the close of 26 bars ago
Close is below the Kumo Cloud
MACD line crosses under the signal line
The script is backtested from 1 June 2022 and provides good returns.
The strategy assumes each order is using 30% of the available coins to make the results more realistic and to simulate you only ran this strategy on 30% of your holdings. A trading fee of 0.1% is also taken into account and is aligned to the base fee applied on Binance.
This script also works well on MATIC (1h timeframe), AVA (45m timeframe), and BTC (30m timeframe).

Ichimoku Cloud with RSI (By Coinrule)The Ichimoku Cloud is a collection of technical indicators that show support and resistance levels, as well as momentum and trend direction. It does this by taking multiple averages and plotting them on a chart. It also uses these figures to compute a “cloud” that attempts to forecast where the price may find support or resistance in the future.
The Ichimoku Cloud was developed by Goichi Hosoda, a Japanese journalist, and published in the late 1960s. It provides more data points than the standard candlestick chart. While it seems complicated at first glance, those familiar with how to read the charts often find it easy to understand with well-defined trading signals.
The Ichimoku Cloud is composed of five lines or calculations, two of which comprise a cloud where the difference between the two lines is shaded in.
The lines include a nine-period average, a 26-period average, an average of those two averages, a 52-period average, and a lagging closing price line.
The cloud is a key part of the indicator. When the price is below the cloud, the trend is down. When the price is above the cloud, the trend is up.
The above trend signals are strengthened if the cloud is moving in the same direction as the price. For example, during an uptrend, the top of the cloud is moving up, or during a downtrend, the bottom of the cloud is moving down.
This strategy combines the Ichimoku Cloud with the RSI indicator to better enter trades.
Long/Short orders are placed when three basic signals are triggered.
Long Position:
Tenkan-Sen is above the Kijun-Sen
Chikou-Span is above the close of 26 bars ago
Close is above the Kumo Cloud
RSI is greater less than 50
Short Position:
Tenkan-Sen is below the Kijun-Sen
Chikou-Span is below the close of 26 bars ago
Close is below the Kumo Cloud
RSI is greater than 50
The script is backtested from 1 June 2022 and provides good returns.
The strategy assumes each order is using 30% of the available coins to make the results more realistic and to simulate you only ran this strategy on 30% of your holdings. A trading fee of 0.1% is also taken into account and is aligned to the base fee applied on Binance.
This script also works well on SOL (45m timeframe), BNB (1h timeframe), and ETH (1h timeframe).

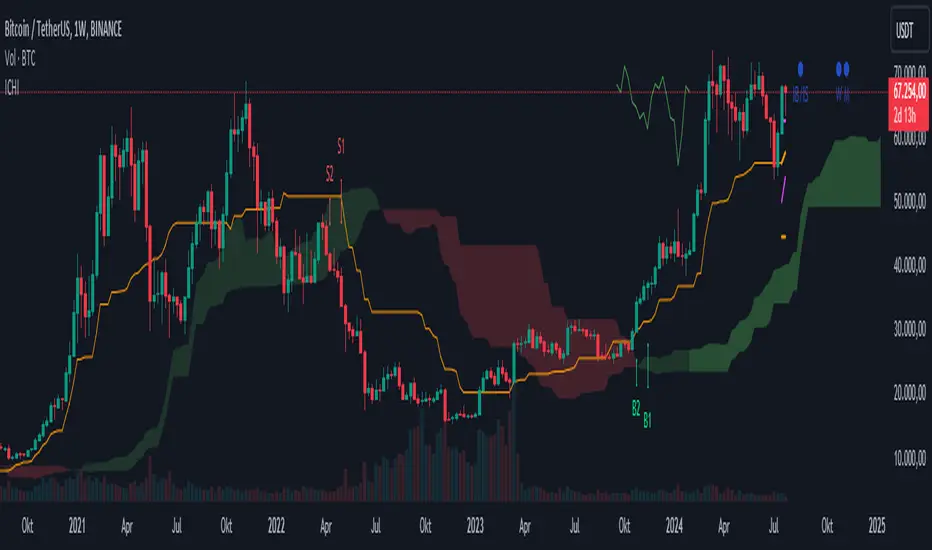
Ichimoku Kinkō hyō 目均衡表█ OVERVIEW
Ichimoku is known to be an Indicator that completes itself, for its power but also for its complexity. This is why I decided to improve the work of
Goichi Hosoda in order to offer the maximum number of options for the most seasoned users but also beginners with options to simplify the
reading of Ichimoku (such as a panel directly giving you the status of each Ichimoku options or Supports/Resistances drawn automatically
according to the conditions chosen in the settings.
█ OPTIONS
Here is the complete list of options to implement :
- "Source" and "Alternative Source" (with lots of choices)
- Heikin Ashi volume.
- Weighted Moving Average Smoothing
- Minimum, Maximum and Adaptive Percentage Length adjustable for Tenkan-Sen, Kijun-Sen, Chikou Span and Senkou-Span)
- The Chikou has a Filter with modifiable Length (in Lookback Percentage)
- Advanced Filter Settings: Volume, Tenkan-Sen/Kijun-Sen Cross, Volatility, Tenkan-Sen Equal Kijun-Sen, Chikou Greater Than Price,
Chikou Momentum, Price Greater Than Kumo, Price Greater Than Tenkan-Sen, Chikou Trend Filter .
- Oscillator volume adjustable via drop-down menu with 5 types of oscillators available: "TFS Volume", "On Balance Volume",
"Klinger Volume", "Cumulative Volume", "Volume Zone".
- Relative Volume Strength Index with Length, Peak and EMA's adjustable. 3 Oscillators available: “On Balance Volume”,
“Cumulative Volume”, “Price Volume Trend”.
- Volatility adjustable with Fast and Slow Length.
- Totally customizable Support and Resistance.
- Bar Trend Color based on chosen settings.
- Fully customizable help panel.
- Alerts available for: Labels Detection, Support/Resistance Line Cross, Panel Trend Status Direction.
█ NOTES
Remember to only make a decision once you are sure of your analysis. Good trading sessions to everyone and don't forget,
risk management remains the most important!

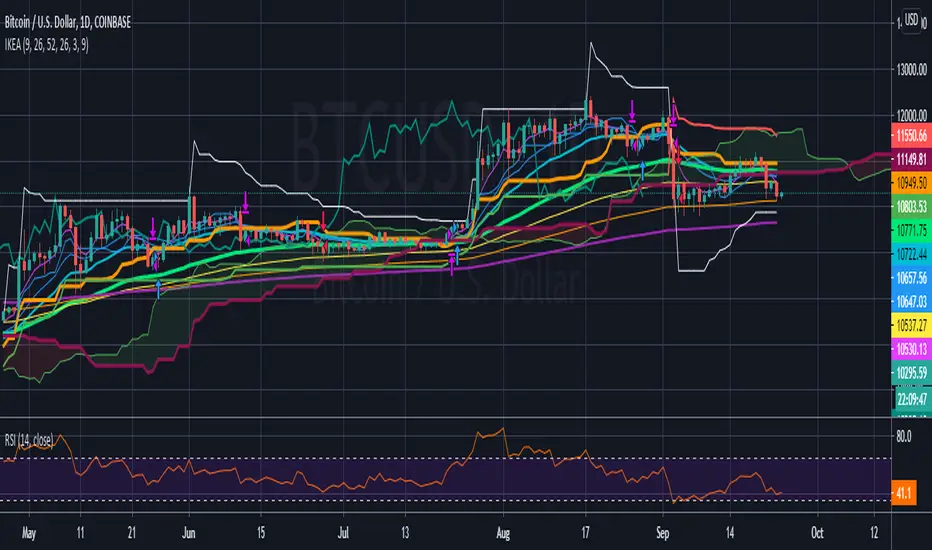
Ichimoku + Forecast + SignalsIchimoku Kinko Hyo (IKH) (Japanese一目均衡表, Ichimoku Kinkō Hyō), usually shortened to "Ichimoku", is a technical analysis method that builds on candlestick charting to improve the accuracy of forecast price moves. - From Wikipedia, the free encyclopedia
This indicator is enhanced with the following helpful features:
Tenkan-sen, Kijun-sen, Senkou Span A and Senkou Span B 5 days forecast
identified bullish (green color), bearish (red color), or flat/within (gray color) signals including the number of days it accrued from the last bar and the place of appearance (▲ - above bullish Kumo, △ - above bearish Kumo, ◆ - within bullish Kumo, ◇ - within bearish Kumo, ▼ - bellow bullish Kumo, ▽ - bellow bearish Kumo)
lines indicating the range of the Tenkan-sen, Kijun-sen, and Senko Span B calculations (we can easily identify the highest-high and the lowest-low of the range and how long it will persist)
Signals description:
C/TK - bullish/bearish Close/Tenkan-sen cross
C/KJ - bullish/bearish Close/Kijun-sen cross
C/KM - bullish/bearish/within Close/Kumo cross
TK - bullish/bearish/flat Tenkan-sen
TK/KJ - bullish/bearish Tenkan-sen/Kijun-sen cross
TK/KM - bullish/bearish/within Tenkan-sen/Kumo cross
KJ - bullish/bearish/flat Kijun-sen
KJ/KM - bullish/bearish/within Kijun-sen/Kumo cross
SA - bullish/bearish/flat Senkou Span A
SB - bullish/bearish/flat Senkou Span B
KM - bullish/bearish Kumo
FKM - bullish/bearish future Kumo
CH/P - bullish/bearish Chikou Span/Price cross
CH/KM - bullish/bearish/within Chikou Span/Kumo cross
Ichimoku Support and Resistance by TheSocialCryptoClubName: Ichimoku Supports and Resistances
Category: Indicator
Timeframe: Any Timeframe.
Description: Ichimoku Support and Resistance is an indicator which allows to represent on the chart the price structures identified through the flat zones of the various lines of the Ichimoku Kinko Hyo indicator
Suggested usage: Use on any timeframe. It is possible to calculate flat zones only in a certain period and in a different time frame, and select those calculated by specific lines.
Technical Details: Internally it uses an Array to store the levels of when a line is flat (calculating the distance to the previous one). At the last bar it prints the various lines on the screen.
Credits:
- Some of the indications has been explained by Corrado Rondelli in "Strategie di trading con l’indicatore Ichimoku Kinko Hyo"

Ichimoku LibraryLibrary "Ichimoku"
Ichimoku Kinko Hyo library
calc(conversion, base, lead, displacement1, displacement2) : Calculate the Ichimoku Kinko Hyo values
Parameters:
conversion : Conversion line' periods
base : Base line's periods
lead : 2nd Leading line's periods
displacement1 : Leading line's offset
displacement2 : Lagging line's offset
Returns:

Scalping IchimokuBased on the Ichimoku Cloud indicator, the Scalping Ichimoku is a strategy applied in a simple form.
How the strategy works?
The indicator will watch two filters from the Ichimoku Cloud indicator. The first one is when the price crosses the cloud (over or under). The second filter is when the conversion line crosses the baseline (over or under). When both filters happen, no matter the order or when the indicator will print an arrow signal.
Buy Signal
A buy signal, or arrow up, will appear when the price crosses over the cloud and when the conversion line crosses over the baseline.
Sell Signal
A sell signal, or arrow down, will appear when the price crosses under the cloud and the conversion line crosses under the baseline.
Exit Points
Show Exit Spots enabled. The indicator will print possible exit spots for the last entry, based on the cross from conversion with baseline. In case the cross is against the latest entry signal, it will show an "X"
One Signal At Time
The indicator will print only one signal in a single direction. It will never print the same signal as the last signal
Exit and Entry Spot At The Same Candle
In the chart, when the entry spot and an exit spot appear in the same candle, the exit spot will appear with a different color. This means that the entry spot is more accurate.
This strategy was designed for scalping, no matter the time frame or market, but it may work for swing traders as well.

Ichimoku EMA RSI - Crypto only long StrategyHey there!
Here I show you an Ichimoku Cloud Strategy.
I discovered the strategy on a YouTube channel and tried to transfer it as a strategy into a script.
He said in his video that you would make more profit with this strategy than holding the coin.
Tested with the crypto pair ETH/USDT in the four hour chart.
Period: beginning of 2017 until today.
The strategy should also work with foreign exchange. But then the settings have to be adjusted.
There is the possibility to activate two EMA's and a Stochastic RSI .
-----------------------------------------------------------------------------------
How does the strategy work?
ENTRY
The green Ichimoku lead line must above the red Ichimoku lead line - only the two lead lines are activated.
A green candle must closed above the green lead line.
EXIT
A red candle must close below the green Ichimoku lead line.
OPTIONAL ENTRY
EMA
Once you activate the EMA , long positions will only be taken once the EMA1 is above the EMA2.
Thereby I could observe a significant increase of the profit as well as a decrease of the maximum drawdown.
RSI
As soon as you activate the Stochastic RSI , long positions are only taken when the K line is above the D line.
In the future, I may add an oversold - undersold parameter.
The results of the strategy are without commissions and levers.
If you have any questions or feedback, please let me know in the comments.
If you need more information about the strategy and want to know exactly how to apply it, check out my profile.
I wish you good luck with the strategy!

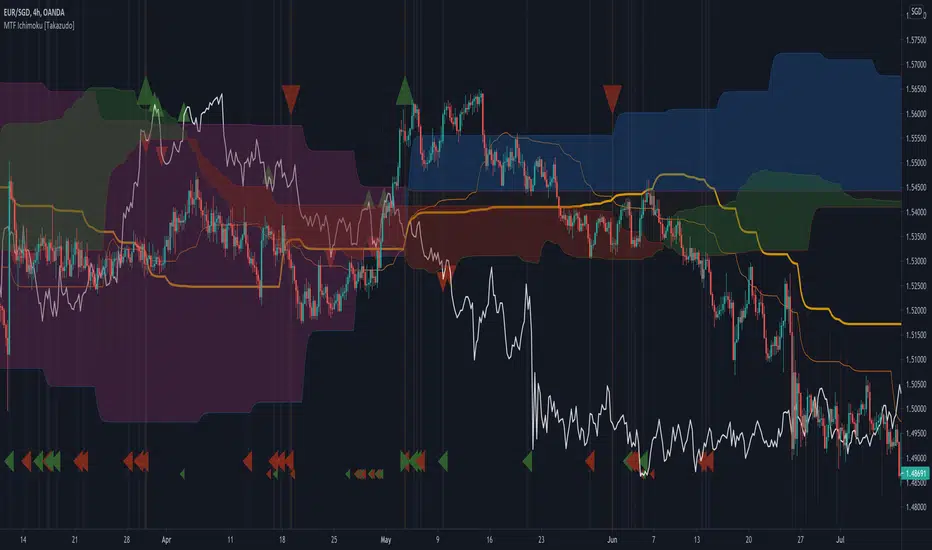
MTF Ichimoku [Takazudo]- A multi time frame Ichimoku with messy hint highlights.
- Most of MTF Ichimoku scripts doesn't handle Chikou-span's place correctly. This script does.
- This script was made to refer the 1day timeframe Ichimoku in lower timeframes.
- I use 1day timeframe mainly. But my entry is always in 4h or 1h timeframe.
OANDA:USDJPY
ICHIMOKU forecast öngörü Hi every Ichimoku Users,
ichimoku is a very useful indicator. It works very well in short periods.İ t helps me define market trends, find entry and follow.
However, it may take a lot of time to calculate which direction the lines will go.( kijun. tenkan and clouds). In the short-term charts, this is not what we want.
I'm sure you said yes.
ichimoku forecast will do this now.
will show us the next 3 candles.
ICHIMOKU FORECAST (öngörü) strengths:
- Forecast future +3 candles will make clouds, tenkan, kijun go!
- Help you indentify easy trend when clouds change, kijun go up or down!
- you can change colors, displacement, hide/show lines in its.
- Flexible and good for every timeframe: W, D, 4H, 1H and shorter.
- Flexible and good for every currencies, gold , future and more.
Test it, watch it, you'll see it works.

Ichimoku Kinko Hyo Strategy+ EMA + 3ATRThis trading strategy uses combination of the Ichimoku Kinko Hyo system with Fibonacci numbers based 13/21/55 exponential moving average ( EMA ) crossover, giving good results in various trending assets !
Also has the Trend-following indicator combining SuperTrend with Chiku breakout from Ichimoku is added in order to confirm trend pattern.
The Ichimoku Kinko Hyo system includes five kinds of signal, of which this strategy uses the most recent of ones i.e. Tenkan Sen / Kijun Sen Cross and price crosses the Kijun Sen. As the Chikou Span, Senkou Span A and Senkou Span B are shifted into the past/future.
The Tenkan Sen, also known as the Turning or Conversion line, is a moving average of the highest high and lowest low over the last 9 periods in this strategy.
The Kijun Sen, also known as the Standard or Base line, is a moving average of the highest high and lowest low over the last 26 periods in this strategy.
The Chikou Span, also known as the Lagging line, is the closing price plotted 26 periods behind in this strategy.
The Senkou Span A, also known as the 1st leading line, is a moving average of the Tenkan Sen and Kijun Sen and is plotted 26 periods ahead in this strategy.
The Senkou Span B, also known as the 2nd leading line, is a moving average of the highest high and lowest low over the last 52 trading days is plotted 26 periods ahead in this strategy.
EMA is quicker to react to the current market price is because EMA gives more importance to the most recent data points. This helps the trader to take quicker trading decisions. Just used the laws of nature for EMA numbers: taken from Fibonacci sequence numbers 13/21/55
A SuperTrend employs ATR values to calculate the indicator values. The SuperTrend indicator combined with Chiku breakout from Ichimoku and plotted. The indicator line changes its color between green and red based on the price momentum in the underlying.