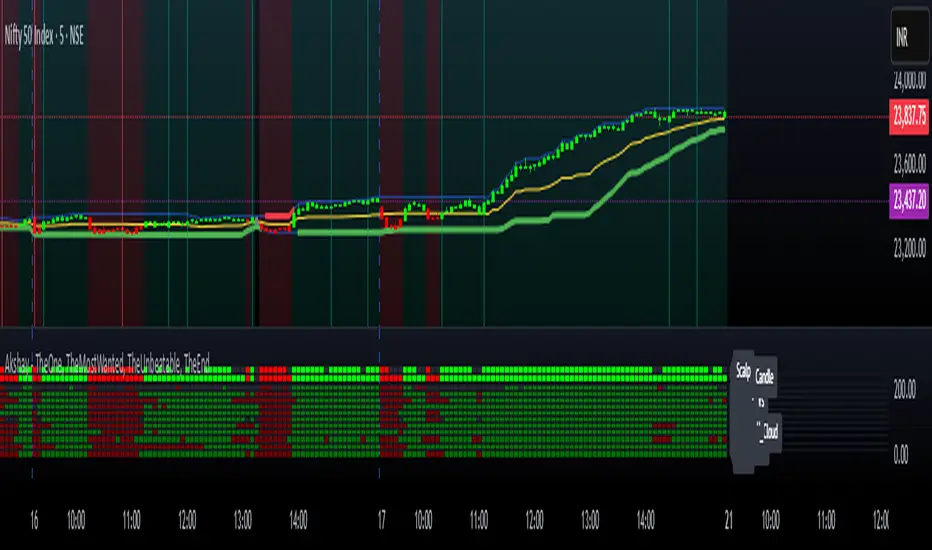
Akshay - TheOne, TheMostWanted, TheUnbeatable, TheEnd➤ All-in-One Solution (❌ No repaint):
This Technical Chart contains, MA24 Condition, Supertrend Indicator, HalfTrend Signal, Ichimoku Cloud Status, Parabolic SAR (P_SAR), First 5-Minute Candle Analysis (ORB5min), Volume-Weighted Moving Average (VWMA), Price-Volume Trend (PVT), Oscillator Composite, RSI Condition, ADX & Trend Strength.
Technicals don't lie.
🚀 Overview and Key Features
Comprehensive Multi-Indicator Approach:
The script is built to be an all-in-one technical indicator on TradingView. It integrates several well-known indicators and overlays—including Supertrend, HalfTrend, Ichimoku Cloud, various moving averages (EMA, SMA, VWMA), oscillators (Klinger, Price Oscillator, Awesome Oscillator, Chaikin Oscillator, Ultimate Oscillator, SMI Ergodic Oscillator, Chande Momentum Oscillator, Detrended Price Oscillator, Money Flow Index), ADX, and Donchian Channels—to create a composite picture of market sentiment.
Signal Generation and Alerts:
It not only calculates these indicators but also aggregates their output into “Master Candle” signals. Vertical lines are drawn on the chart with corresponding alerts to indicate potential buy or sell opportunities based on robust, combined conditions.
Visual Layering:
Through the use of colored histograms, custom candle plots, trend lines, and background color changes, the script offers a multi-layered visual representation of data, providing clarity about both short-term signals and overall market trends.
⚙️ How It Works and Functionality
MA24 Condition:
Uses the 24-period moving average as a proxy; if the price is above it, the bar is colored green, and red if below, with neutrality when conditions aren’t met.
Supertrend Indicator:
Evaluates price relative to the Supertrend level (calculated via ATR), coloring green when price is above it and red when below.
HalfTrend Signal:
Determines trend shifts by comparing the current close to a calculated trend level; green indicates an upward trend, while red suggests a downtrend.
Ichimoku Cloud Status:
Analyzes the relationship between the Conversion and Base lines; a bullish (green) signal is given when price is above both or the Conversion line is higher than the Base line.
Parabolic SAR (P_SAR):
Colors the signal based on whether the current price is above (green) or below (red) the Parabolic SAR marker, indicating stop and reverse conditions.
First 5-Minute Candle Analysis (ORB5min):
Uses key levels from the first 5-minute candle; if price exceeds the candle’s low, VWAP, and MA, it’s bullish (green), otherwise bearish (red).
Volume-Weighted Moving Average (VWMA):
Compares the current price to volume-weighted averages; a price above these levels is shown in green, below in red.
Price-Volume Trend (PVT):
Determines bullish or bearish momentum by comparing PVT to its VWAP—green when above and red when below.
Oscillator Composite:
Aggregates signals from multiple oscillators; a majority of positive results turn it green, while negative dominance results in red.
RSI Condition:
Uses a simple RSI threshold of 50, with values above signifying bullish (green) momentum and below marking bearish (red) conditions.
ADX & Trend Strength:
Reflects overall trend strength through ADX and directional movements; a combination favoring bullish conditions colors it green, with red signaling bearish pressure.
Master Candle Overall Signal:
Combines multiple indicator outputs into one “Master” signal—green for a consensus bullish trend and red for a bearish outlook.
Scalp Signal Variation:
Focused on short-term price changes, this signal adjusts quickly; green indicates improving short-term conditions, while red signals a downturn.
📊 Visualizations and 🎨 User Experience (❌ no repaint)
Dynamic Histograms & Bar Plots:
Each indicator is represented as a colored bar (with added vertical offsets) to facilitate easy comparison of their respective bullish or bearish contributions.
Clear Color-Coding & Labels:
Green (e.g., GreenFluorescent) indicates bullish sentiment.
Red (e.g., RedFluorescent) indicates bearish sentiment.
Custom labels and descriptive text accompany each bar for clarity.
Interactive Charting:
The overall background color adapts based on the “Master Candle” condition, offering an instant read on market sentiment.
The current candlestick is overlaid with color cues to reinforce the indicator’s signal, enhancing the trading experience.
Real-Time Alerts:
Vertical lines appear on signal events (buy/sell triggers), complemented by alerts that help traders stay on top of actionable market moves.
Sharp lines:
The Sharp lines are plotted based upon the EMA5 cross over with the same market trend, marks this as good time to reentry.
🔧 Settings and Customization
Flexible Timeframe Input:
Users can select their preferred timeframe for analysis, making the indicator adaptable to intraday or longer-term trading styles.
Customizable Indicator Parameters:
➤ Supertrend: Adjust ATR length and multiplier factors.
➤ HalfTrend: Tweak amplitude and channel deviation settings.
➤ Ichimoku Cloud & Oscillators: Fine-tune the conversion/base lines and oscillator lengths to match individual trading strategies.
Visual Customization:
The script’s color schemes and plotting styles can be altered as needed, giving users the freedom to tailor the interface to their taste or existing chart setups.
🌟 Uniqueness of the Concept
Integrated Multi-Indicator Synergy:
Combines a diverse range of trend, momentum, and volume-based indicators into a single cohesive system for a holistic market view.
Master Candle Aggregation:
Consolidates numerous individual signals into a "Master Candle" that filters out noise and provides a clear, consensus-based trading signal.
Layered Visual Feedback:
Uses color-coded histograms, adaptive background cues, and dynamic overlays to deliver a visually intuitive guide to market sentiment at a glance.
Customization and Flexibility:
Offers adjustable parameters for each indicator, allowing users to tailor the system to fit diverse trading styles and market conditions.
✅ Conclusion:
Robust Trading Tool & Non-Repainting Reliability:
This versatile technical analysis tool computes an extensive range of indicators, aggregates them into a stable, non-repainting “Master Candle” signal, and maintains consistent, verifiable outputs on historical data.
Holistic Market Insight & Consistent Signal Generation:
By combining trend detection, momentum oscillators, and volume analysis, the indicator delivers a comprehensive snapshot of market conditions and generates dependable signals across varying timeframes.
User-Centric Design with Rich Visual Feedback:
Customizable settings, clear color-coded outputs, adaptive backgrounds, and real-time alerts work together to provide actionable, transparent feedback—enhancing the overall trading experience.
A Unique All-in-One Solution:
The integrated approach not only simplifies complex market dynamics into an easy-to-read visual guide but also empowers systematic traders with a powerful, adaptable asset for accurate decision-making.
❤️ Credits:
Pine Script™ User Manual
Supertrend
Ichimoku Cloud
Parabolic SAR
Price Volume Trend (PVT)
Average Directional Index (ADX)
Volume Oscillator
HalfTrend
Donchian Trend
Cerca negli script per "ichimoku"
Dynamic Trend & Levels by VikOpineThis indicator combines the best aspects of trend-following, volume and price action to help traders make informed decisions and can be used with other indicators for confluence. 🚀
Key Features and Concepts:
Volume-Weighted Moving Average (VWMA):
Unlike a simple moving average, the VWMA gives more weight to price action with higher volume, helping traders identify strong trends backed by significant market participation.
It helps distinguish between low-volume price fluctuations and meaningful market moves.
Volume-Weighted Average Price (VWAP):
Used by institutional traders, VWAP serves as a benchmark to gauge whether the current price is overbought or oversold relative to the average price weighted by volume.
The indicator tracks VWAP levels dynamically, offering insights into price reversion opportunities and breakout confirmations.
Fibonacci Levels (Dynamic Support & Resistance):
The script dynamically plots Fibonacci retracement and extension levels based on recent price swings, allowing traders to identify potential reversal and continuation zones. These levels change colors individually based on them becoming support or resistance.
Fibonacci levels help in setting stop-loss levels and profit targets based on natural market cycles.
Ichimoku Cloud (Trend Confirmation & Market Sentiment):
Provides a multi-dimensional view of trend strength, momentum, and potential reversals.
The Kumo (cloud) helps traders identify support and resistance zones, while the Tenkan-Sen and Kijun-Sen lines confirm trend direction. I prefer to remove the lines and only keep the clouds to anticipate upcoming trend.
How the Indicator Works:
The script dynamically calculates and overlays VWMA and VWAP to give a clear view of volume-backed trends.
Fibonacci levels are recalculated based on recent swing highs and lows, ensuring they remain relevant to current price action. This feature avoids to re-draw Fibs manually.
The Ichimoku Cloud adjusts in real-time to provide trend and momentum signals.
The session volume profile updates dynamically to highlight high-liquidity zones and potential breakout areas.
Alerts can be set up in Tradingview allowing traders to know the price action in real time.
How to Use This Indicator in Trading:
Trend Confirmation: Use VWMA, VWAP, and the Ichimoku Cloud to determine the prevailing trend and avoid trading against market momentum. Go with the trend.
Reversals: Look at the dynamic Fibonacci levels to find key support and resistance areas where price may reverse or consolidate. These levels change color as they become support or resistance.
Breakout & Continuation Trading: Monitor VWAP deviations and Ichimoku signals to identify strong trend continuation setups.
Mean Reversion: Use VWAP re-tests to spot potential pullback entries in established trends.
Alerts: Customize alerts to stay ahead of market moves.
Take advantage of paper trading feature available in Tradingview to familiarize yourself with this indicator. Experience is the best teacher as in any other case.
Ideal for:
✅ Traders looking to capitalize on VWAP trend and level.
✅ Traders utilizing Fibonacci levels and Ichimoku trends for structured trades.
✅ Scalpers leveraging levels and trends for quick entries/exits.
✅ Traders who rely on volume-backed trend confirmations.
No indicator is perfect so take everything with a pinch of salt.
Drop a comment below with your feedback or if you have any question.

SatoshiSteps Swing StrategyCore Components:
The indicator combines three popular technical analysis tools:
Ichimoku Cloud: This helps identify the trend, support, and resistance levels.
RSI (Relative Strength Index): This momentum oscillator identifies overbought and oversold conditions.
MACD (Moving Average Convergence Divergence): This trend-following momentum indicator shows the relationship between two moving averages1 of prices.
Logic:
The strategy aims to identify potential swing trading opportunities by combining signals from these three components. It essentially looks for:
Trend Confirmation (Ichimoku):
Price should be above the Ichimoku cloud for buy signals.
Price should be below the Ichimoku cloud for sell signals.
The Tenkan-sen (conversion line) should cross above the Kijun-sen (base line) for buy signals.
The Tenkan-sen should cross below the Kijun-sen for sell signals.
Overbought/Oversold Conditions (RSI):
RSI should be below the overbought level for buy signals (avoiding buying when the market is potentially overextended).
RSI should be above the oversold level for sell signals (avoiding selling when the market is potentially oversold).
Momentum Confirmation (MACD):
The MACD line should be above the signal line for buy signals (indicating upward momentum).
The MACD line should be below the signal line for sell signals (indicating downward momentum).
Buy Signal:
A buy signal is generated when all the following conditions are met:
The Tenkan-sen crosses above the Kijun-sen.
The price is above both the Senkou Span A and Senkou Span B (the cloud).
The RSI is below the overbought level.
The MACD line is above the signal line.
Sell Signal:
A sell signal is generated when all the following conditions are met:
The Tenkan-sen crosses below the Kijun-sen.
The price is below both the Senkou Span A and Senkou Span B (the cloud).
The RSI is above the oversold level.
The MACD line is below the signal line.
Key Considerations:
Time Frame: The indicator has built-in adjustments for 1-hour and 4-hour timeframes, optimizing the parameters for each.
Customization: You can customize the overbought/oversold RSI levels and the styles of the buy/sell signals (triangle, label, arrow, circle) through the indicator's settings.
Accuracy: While the strategy combines multiple indicators to improve accuracy, remember that no trading indicator is perfect. Market conditions can change rapidly, and false signals can occur.
Risk Management: Always use proper risk management techniques, such as stop-loss orders, and never risk more than you can afford to lose.

TradeShields Strategy Builder🛡 WHAT IS TRADESHIELDS?
This no-code strategy builder is designed for traders on TradingView, offering an intuitive platform to create, backtest, and automate trading strategies. While identifying signals is often straightforward, the real challenge in trading lies in managing risk and knowing when not to trade. It equips users with advanced tools to address this challenge, promoting disciplined decision-making and structured trading practices.
This is not just a collection of indicators but a comprehensive toolkit that helps identify high-quality opportunities while placing risk management at the core of every strategy. By integrating customizable filters, robust controls, and automation capabilities, it empowers traders to align their strategies with their unique objectives and risk tolerance.
_____________________________________
🛡 THE GOAL: SHIELD YOUR STRATEGY
The mission is simple: to shield your strategy from bad trades . Whether you're a seasoned trader or just starting, the hardest part of trading isn’t finding signals—it’s avoiding trades that can harm your account. This framework prioritizes quality over quantity , helping filter out suboptimal setups and encouraging disciplined execution.
With tools to manage risk, avoid overtrading, and adapt to changing market conditions, it protects your strategy against impulsive decisions and market volatility.
_____________________________________
🛡 HOW TO USE IT
1. Apply Higher Timeframe Filters
Begin by analyzing broader market trends using tools like the 200 EMA, Ichimoku Cloud, or Supertrend on higher timeframes (e.g., daily or 4-hour charts).
- Example: Ensure the price is above the 200 EMA on the daily chart for long trades or below it for short trades.
2. Identify the Appropriate Entry Signal
Choose an entry signal that aligns with your model and the asset you're trading. Options include:
Supertrend changes for trend reversals.
Bollinger Band touches for mean-reversion trades.
RSI strength/weakness for overbought or oversold conditions.
Breakouts of key levels (e.g., daily or weekly highs/lows) for momentum trades.
MACD and TSI flips.
3. Determine Take-Profit and Stop-Loss Levels
Set clear exit strategies to protect your capital and lock in profits:
Use single, dual, or triple take-profit levels based on percentages or price levels.
Choose a stop-loss type, such as fixed percentage, ATR-based, or trailing stops.
Optionally, set breakeven adjustments after hitting your first take-profit target.
4. Apply Risk Management Filters
Incorporate risk controls to ensure disciplined execution:
Limit the number of trades per day, week, or month to avoid overtrading.
Use time-based filters to trade during specific sessions or custom windows.
Avoid trading around high-impact news events with region-specific filters.
5. Automate and Execute
Leverage the advanced automation features to streamline execution. Alerts are tailored specifically for each supported platform, ensuring seamless integration with tools like PineConnector, 3Commas, Zapier, and more.
_____________________________________
🛡 CORE FOCUS: RISK MANAGEMENT, AUTOMATION, AND DISCIPLINED TRADING
This builder emphasizes quality over quantity, encouraging traders to approach markets with structure and control. Its innovative tools for risk management and automation help optimize performance while reducing effort, fostering consistency and long-term success.
_____________________________________
🛡 KEY FEATURES
General Settings
Theme Customization : Light and dark themes for a tailored interface.
Timezone Adjustment : Align session times and news schedules with your local timezone.
Position Sizing : Define lot sizes to manage risk effectively.
Directional Control : Choose between long-only, short-only, or both directions for trading.
Time Filters
Day-of-Week Selection : Enable or disable trading on specific days.
Session-Based Trading : Restrict trades to major market sessions (Asia, London, New York) or custom windows.
Custom Time Windows : Precisely control the timeframes for trade execution.
Risk Management Tools
Trade Limits : Maximum trades per day, week, or month to avoid overtrading.
Automatic Trade Closures : End-of-session, end-of-day, or end-of-week options.
Duration-Based Filters : Close trades if take-profit isn’t reached within a set timeframe or if they remain unprofitable beyond a specific duration.
Stop-Loss and Take-Profit Options : Fixed percentage or ATR-based stop-losses, single/dual/triple take-profit levels, and breakeven stop adjustments.
Economic News Filters
Region-Specific Filters : Exclude trades around major news events in regions like the USA, UK, Europe, Asia, or Oceania.
News Avoidance Windows : Pause trades before and after high-impact events or automatically close trades ahead of scheduled news releases.
Higher Timeframe Filters
Multi-Timeframe Tools : Leverage EMAs, Supertrend, or Ichimoku Cloud on higher timeframes (Daily, 4-hour, etc.) for trend alignment.
Chart Timeframe Filters
Precision Filtering : Apply EMA or ADX-based conditions to refine trade setups on current chart timeframes.
Entry Signals
Customizable Options : Choose from signals like Supertrend, Bollinger Bands, RSI, MACD, Ichimoku Cloud, or EMA pullbacks.
Indicator Parameter Overrides : Fine-tune default settings for specific signals.
Exit Settings
Flexible Take-Profit Targets : Single, dual, or triple targets. Exit at significant levels like daily/weekly highs or lows.
Stop-Loss Variability : Fixed, ATR-based, or trailing stop-loss options.
Alerts and Automation
Third-Party Integrations : Seamlessly connect with platforms like PineConnector, 3Commas, Zapier, and Capitalise.ai.
Precision-Formatted Alerts : Alerts are tailored specifically for each platform, ensuring seamless execution. For example:
- PineConnector alerts include risk-per-trade parameters.
- 3Commas alerts contain bot-specific configurations.
_____________________________________
🛡 PUBLISHED CHART SETTINGS: 15m COMEX:GC1!
Time Filters : Trades are enabled from Tuesday to Friday, as Mondays often lack sufficient data coming off the weekend, and weekends are excluded due to market closures. Custom time sessions are turned off by default, allowing trades throughout the day.
Risk Filters : Risk is tightly controlled by limiting trades to a maximum of 2 per day and enabling a mechanism to close trades if they remain open too long and are unprofitable. Weekly trade closures ensure that no positions are carried over unnecessarily.
Economic News Filters : By default, trades are allowed during economic news periods, giving traders flexibility to decide how to handle volatility manually. It is recommended to enable these filters if you are creating strategies on lower timeframes.
Higher Timeframe Filters : The setup incorporates confluence from higher timeframe indicators. For example, the 200 EMA on the daily timeframe is used to establish trend direction, while the Ichimoku cloud on the 30-minute timeframe adds additional confirmation.
Entry Signals : The strategy triggers trades based on changes in the Supertrend indicator.
Exit Settings : Trades are configured to take partial profits at three levels (1%, 2%, and 3%) and use a fixed stop loss of 2%. Stops are moved to breakeven after reaching the first take profit level.
_____________________________________
🛡 WHY CHOOSE THIS STRATEGY BUILDER?
This tool transforms trading from reactive to proactive, focusing on risk management and automation as the foundation of every strategy. By helping users avoid unnecessary trades, implement robust controls, and automate execution, it fosters disciplined trading.

Volume and Price, EMA Hierarchy Scoring Relations V 1.1Understanding the Volume and Price, EMA Hierarchy Scoring Indicator
Financial markets are often analyzed through a series of technical indicators, each providing valuable but isolated insights into price movements, volume dynamics, and trends. While these tools are widely used, they often lack context when applied individually. The Volume and Price, EMA Hierarchy Scoring Indicator was developed to bridge this gap by introducing structure, context, and relationships between these known indicators.
By utilizing Exponential Moving Averages (EMAs) and assigning periods derived from prime numbers, this indicator creates a scoring system that evaluates the relative positioning and interaction of 13 widely used technical tools. This approach adds meaning to individual indicator outputs by:
Revealing how their results align, diverge, or complement each other.
Quantifying their collective behavior through a hierarchy scoring system.
Enabling traders to not only analyze indicators individually but also combine them to uncover how they influence and interact with each other.
The result is a tool that provides clarity and insight into market behavior, enabling traders to move beyond surface-level analysis and uncover deeper patterns and relationships within the data.
Key Features and Methodology
The Volume and Price, EMA Hierarchy Scoring Indicator is built on a robust mathematical framework that evaluates and visualizes the relationships between 13 widely used technical indicators. By leveraging Exponential Moving Averages (EMAs) and prime numbers, the indicator provides meaningful insights into individual indicator performance as well as their combined behavior.
1. EMA Hierarchy Scoring
At the core of the indicator is its ability to assess the hierarchy of EMAs for each tool. This hierarchy scoring evaluates how the EMAs are aligned relative to one another, providing traders with a quantifiable measure of the indicator's internal consistency and its alignment with trends.
How It Works:
Each EMA is assigned a period derived from a unique prime number. This ensures that no two EMAs overlap, preserving their individuality.
The scoring system measures the gaps between these EMAs, assigning weighted values to these relationships based on their position in the hierarchy.
Why Prime Numbers?
Prime numbers ensure that the EMA periods are distinct and mathematically unrelated, creating a structured yet diverse dataset for analysis.
This approach allows the scoring system to capture both short-term and long-term trends, while avoiding redundancy.
2. Independent Indicator Evaluation
One of the key features of this indicator is the ability to analyze any of the 13 tools individually. Each indicator has its own module, complete with adjustable parameters and dedicated visualizations:
Histograms: Represent the raw EMA hierarchy score. Positive bars indicate alignment with upward trends, while negative bars highlight potential reversals or misalignments.
Smoothed Line: Averages the histogram values, reducing short-term noise and emphasizing longer-term trends.
Signal Line: Highlights trend shifts by smoothing the smoothed line further. Crossovers between the smoothed line and the signal line act as actionable signals for traders.
3. Combining Indicators for Context
Beyond individual analysis, the indicator allows users to combine multiple indicators to evaluate their interactions. For example:
Pairing ALMA (price smoothing) with Volume enables traders to see how price trends are supported or contradicted by market activity.
Combining Delta Volume and CMF (Chaikin Money Flow) reveals nuanced dynamics of buying and selling pressure.
Number of Combinations
With 13 tools available, the indicator supports "two to the power of thirteen minus one," which equals 8,191possible combinations. This flexibility empowers traders to experiment with various subsets of indicators, tailoring their analysis to specific market conditions or strategies.
Detailed Breakdown of Indicators
The Volume and Price, EMA Hierarchy Scoring Indicator integrates 13 widely used technical indicators, each bringing a unique perspective to market analysis. These indicators are scored individually using the EMA hierarchy system and can also be combined for more comprehensive insights.
Here’s a detailed look at what each indicator contributes:
Price Analysis
Arnaud Legoux Moving Average (ALMA):
Purpose:
ALMA smooths price data, reducing noise while maintaining responsiveness to trends.
Unique Features:
The EMA hierarchy scoring highlights how well ALMA’s EMAs align, revealing the strength of price trends.
Visualization includes a histogram of ALMA scores, a smoothed line, and a signal line.
Settings:
Adjustable parameters for the window size, offset, and sigma.
Tooltips guide users on how each setting affects the calculation.
Application:
Evaluate price momentum or combine with volume-based indicators to validate trends.
2. Price Hierarchy Score (PRC):
Purpose:
Focuses solely on price behavior to identify consistency and strength.
Visualization:
Includes a histogram representing raw scores and smoothed and signal lines for trend detection.
Settings:
Adjustable EMA periods derived from prime numbers.
Customizable smoothing and signal periods.
Volume Insights
3. Chaikin Money Flow (CMF):
Purpose:
Integrates price and volume data to measure capital flow direction and strength.
Visualization:
Raw CMF hierarchy scores are plotted, alongside smoothed and signal lines for easier trend identification.
Settings:
Lookback period adjustment for CMF calculation.
Toggle for enabling/disabling the module.
Application:
Use alongside Delta Volume to assess buying and selling pressure.
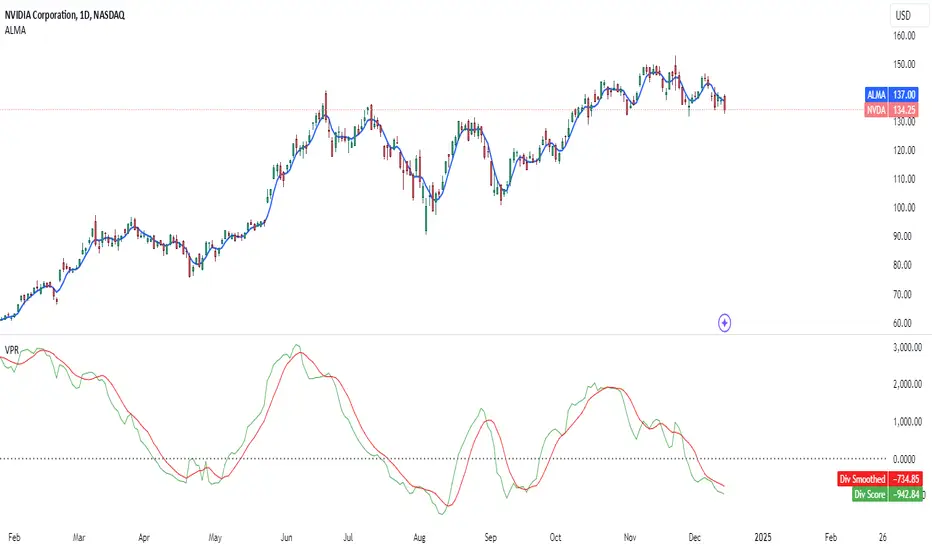
Above chart snapshot, in addition to the well-known CMF indicator, the Volume and Price indicator and the EMA Hierarchy Scoring can also be seen in the chart. By enabling the CMF evaluation, you can observe both how the CMF is analyzed and how it aligns with the price chart.
4. Delta Volume:
Purpose:
Captures the balance between buying and selling activity in the market.
Visualization:
A histogram represents the raw divergence in buying and selling strength.
Signal lines help identify momentum shifts.
Settings:
Options to set lower timeframes for more granular analysis.
Adjustable smoothing and signal periods.
Application:
Combine with CMF for a deeper understanding of capital flow dynamics.
In the above chart, alongside the Volume Delta indicator, you can observe our evaluation of this indicator's performance.
In the above chart, as explained, you can observe the impact of our evaluation metrics both individually and in combination with other indicators. This chart featuring VPR (Volume and Price Indicator along with EMA Hierarchy Scoring) illustrates the interplay between CMF and Volume Delta.
5. Volume Hierarchy Score (VOL):
Purpose:
Tracks raw volume data to identify areas of heightened market activity.
Visualization:
Histogram and smoothed lines highlight volume trends.
Settings:
Prime-numbered EMA periods to analyze volume hierarchy.
Adjustable smoothing and signal line parameters.
In the above chart, as previously explained, by analyzing the EMA of volume data over 25 iterations within specified periods (based on the first 25 prime numbers), you can observe the relationship between volume and price. We are witnessing a price increase, while the current volume position shows significant deviation and instability relative to the EMAs calculated over 25 different time periods.
In the above chart, by simultaneously enabling the evaluation of both volume and price, you can clearly observe the interplay and impact of volume and price in relation to each other.
Momentum and Trend Strength
6. Aroon Up:
Purpose:
Evaluates the strength of trends by measuring time since price highs.
Visualization :
Hierarchy scores plotted as histograms with trend-tracking smoothed and signal lines.
Settings:
Lookback period adjustments.
Module toggle for focus on Aroon trends.
If the analysis and interpretation of Aroon lines seem somewhat complex, the Volume and Price Indicator along with EMA Hierarchy Scoring provides a clear and intuitive representation of the Aroon indicator in relation to the price chart, as you can see in the current chart.
7. Average Directional Index (ADX):
Purpose:
Quantifies the strength of trends, regardless of direction.
Visualization:
ADX scores and smoothed lines for trend confirmation.
Settings:
Adjustable directional indicator (DI) and ADX smoothing periods.
Tooltip guidance for parameter optimization.
The simultaneous chart of the well-known ADX indicator alongside the evaluation system of the Volume and Price Indicator with EMA Hierarchy Scoring provides an integrated perspective on the ADX indicator.
8. Elder Force Index (EFI):
Purpose:
Combines price and volume to measure the strength of price movements.
Visualization:
EFI hierarchy scores with clear trend representation through signal and smoothed lines.
Settings:
Length adjustments for sensitivity control.
Smoothing and signal line customization.
In the above chart, we simultaneously have the well-known EFI indicator and the Volume and Price Indicator along with EMA Hierarchy Scoring. As we progress further, you will become increasingly familiar with the functionality and precision of the Volume and Price Indicator along with EMA Hierarchy Scoring.
Volatility and Oscillators
9. Ehler Fisher Transform:
Purpose:
Highlights extreme price movements by transforming price data into a Gaussian distribution.
Visualization:
Fisher Transform scores with smoothed trend indicators.
Settings:
Fisher length adjustment.
Module toggle and smoothing controls.
10. McGinley Dynamic (MGD):
Purpose:
Tracks price trends while adjusting for volatility, providing a smoother signal.
Visualization:
Raw MGD hierarchy scores with smoothed and signal lines.
Settings:
Lookback period customization.
Adjustable smoothing and signal periods
.
Ichimoku Components
11. Conversion Line (ICMC):
Purpose:
Captures short-term price equilibrium levels within the Ichimoku framework.
Visualization:
Short-term hierarchy scores visualized with smoothed lines.
Settings:
Adjustable conversion line length.
Tooltips explaining Ichimoku-related insights.
12. Base Line (ICMB):
Purpose:
Identifies medium-term equilibrium levels in the Ichimoku system.
Visualization:
Scores and smoothed trend lines for medium-term trends.
Settings:
Base line period adjustments.
Tooltip guidance for Ichimoku analysis.
In the chart below, to better illustrate the capabilities of the Volume and Price, EMA Hierarchy Scoring relation, we present a chart that evaluates the simultaneous interaction of Ichimoku Base and Conversion lines, Price, Volume, and Delta Volume.
Market Health
13. Money Flow Index (MFI):
Purpose:
Detects overbought or oversold conditions using price and volume data.
Visualization:
MFI hierarchy scores with trend tracking through smoothed and signal lines.
Settings:
Lookback period customization for sensitivity adjustment.
Module toggle and visualization controls.
EMA of Indicators: A Unified Scoring Metric
The EMA of Indicators module introduces a unique way to aggregate and analyze the individual scores of all 13 indicators. By applying a unified EMA calculation to their hierarchy scores, this module provides a single, combined metric that reflects the overall market sentiment based on the collective behavior of all indicators.
How It Works
1. Indicator-Specific EMAs:
An EMA is calculated for each of the 13 indicator hierarchy scores. The EMA period is adjustable in the settings menu, allowing traders to control how responsive the metric is to recent changes.
2. Combined EMA Calculation:
The individual EMAs are summed and averaged to generate a single Combined EMA Value. This value represents the average performance and alignment of all the indicators.
3. Smoothed and Signal Lines:
To enhance the interpretability of the Combined EMA Value:
- A Smoothed EMA is calculated using an additional EMA to filter out short-term fluctuations.
- A Signal Line is applied to the Smoothed EMA, providing actionable signals when crossovers occur.
Visualization
The Combined EMA Value is visualized as:
Histogram Bars: Represent the raw Combined EMA Value, highlighting positive or negative market alignment.
Smoothed Line: Tracks longer-term trends by smoothing the combined value.
Signal Line: Marks potential shifts in market sentiment when it crosses the Smoothed Line.
Customization and Settings
The settings menu allows full control over the EMA calculation:
Enable/Disable Module: Toggle the entire EMA of Indicators functionality.
Adjust EMA Period: Define the responsiveness of the individual indicator EMAs.
Set Smoothing Period: Control the degree of smoothing applied to the combined score.
Signal Line Period: Fine-tune the signal line's sensitivity for detecting trend shifts.
Tooltips accompany each parameter, ensuring that users understand their impact on the final visualization.
Applications in Market Analysis
1. Market Health Overview:
Use the Combined EMA Value as a quick snapshot of overall market sentiment based on all 13 indicators.
2. Trend Confirmation:
Analyze crossovers between the Smoothed EMA and Signal Line to confirm market trends or reversals.
3. Flexible Strategy Development:
Adjust EMA and smoothing periods to align the module with short-term or long-term trading strategies.
From EMA Scoring to Divergence-Weighted Insights
While the EMA scoring system provides insights into individual indicators and their trends, the Divergence-Weighted Volatility Adjusted Score takes this analysis further by combining and comparing all 13 indicators into a unified metric.
The Divergence-Weighted Volatility Adjusted Score
This score evaluates how the EMA scores of the 13 indicators interact and diverge, adding a layer of context and collective behavior analysis to the raw hierarchy scores.
1. Normalization:
All EMA scores are scaled to a common range, ensuring comparability regardless of the magnitude of individual indicators.
2. Divergence Analysis:
The system calculates the average score of the 13 indicators and evaluates the deviation (or divergence) of each individual score from this average.
Indicators with significant divergence are highlighted, as they often signal critical market dynamics.
3. Dynamic Weighting:
Indicators with greater divergence are assigned higher weights in the combined score. This ensures that outliers with meaningful signals are emphasized.
4. Volatility Adjustment:
The combined score is adjusted based on market volatility (calculated as the standard deviation of the score over a defined lookback period). This stabilizes the output, making it reliable even during turbulent market conditions.
Visualization and Customization
The Divergence-Weighted Volatility Adjusted Score is plotted as a dynamic line chart, offering a clear visual summary of the collective behavior of all indicators. The chart includes:
Smoothed Score Line: Filters out noise and emphasizes longer-term trends.
Signal Line: Helps identify potential trend shifts by tracking smoothed score crossovers.
Settings:
Lookback Period: Defines the time frame for volatility calculation.
Smoothing Period: Controls the degree of noise reduction in the smoothed score line.
Signal Line Period: Adjusts the responsiveness of the signal line.
These settings are fully adjustable, with tooltips guiding users to understand their impact.
Applications
The Divergence-Weighted Volatility Adjusted Score has several practical applications:
1. Cross-Indicator Alignment:
Detect when multiple indicators align or diverge, signaling potential opportunities or risks.
2. Dynamic Market Insights:
Adapt to changing conditions with the volatility-adjusted scoring.
3. Trend Confirmation:
Use smoothed and signal lines to validate trends identified by individual indicators.
Conclusion
The Volume and Price, EMA Hierarchy Scoring Indicator redefines how traders analyze financial markets. By combining 13 widely used technical tools with a structured scoring system based on Exponential Moving Averages (EMAs) and prime-numbered periods, this indicator brings depth and context to market analysis.
Key features include:
Independent Analysis: Evaluate individual indicators with precise EMA hierarchy scoring to assess their alignment with market trends.
Dynamic Combinations: Explore the relationships between indicators through over 8,000 combinations to uncover nuanced interactions and patterns.
Divergence-Weighted Scoring: Compare the collective behavior of indicators using a divergence-weighted system, providing a holistic market perspective adjusted for volatility.
Customization: Enable or disable modules, adjust smoothing and signal periods, and fine-tune settings to align the indicator with specific trading strategies.
User-Friendly Visualizations: Intuitive histograms, smoothed lines, and signal lines help traders identify trends, reversals, and market alignment at a glance.
This indicator empowers traders to move beyond isolated analysis by creating meaning and context between known tools. Whether you’re a scalper seeking short-term trends or a swing trader analyzing broader market movements, the Volume and Price, EMA Hierarchy Scoring Indicator offers insights tailored to your strategy.
Disclaimer
The Volume and Price, EMA Hierarchy Scoring Indicator is a tool for technical analysis and market evaluation. While it provides structured insights into market behavior, no indicator can guarantee success or eliminate the inherent risks of trading. Market conditions are complex, and multiple factors influence price movements.
Users are advised to:
Combine this indicator with other analysis methods, such as fundamental analysis or risk management strategies.
Make informed decisions based on their own analysis, trading goals, and risk tolerance.
Trading involves significant risk, and past performance does not guarantee future results. Always consult with a financial advisor or professional before making trading decisions.
DeepSignalFilterHelpersLibrary "DeepSignalFilterHelpers"
filter_intraday_intensity(useIiiFilter)
Parameters:
useIiiFilter (bool)
filter_vwma(src, length, useVwmaFilter)
Parameters:
src (float)
length (int)
useVwmaFilter (bool)
filter_nvi(useNviFilter)
Parameters:
useNviFilter (bool)
filter_emv(length, emvThreshold, useEmvFilter, useMovingAvg)
EMV filter for filtering signals based on Ease of Movement
Parameters:
length (int) : The length of the EMV calculation
emvThreshold (float) : The EMV threshold
useEmvFilter (bool) : Whether to apply the EMV filter
useMovingAvg (bool) : Whether to use moving average as threshold
Returns: Filtered result indicating whether the signal should be used
filter_adi(length, threshold, useAdiFilter, useMovingAvg)
ADI filter for filtering signals based on Accumulation/Distribution Index
Parameters:
length (int) : The length of the ADI moving average calculation
threshold (float) : The ADI threshold
useAdiFilter (bool) : Whether to apply the ADI filter
useMovingAvg (bool) : Whether to use moving average as threshold
Returns: Filtered result indicating whether the signal should be used
filter_mfi(length, mfiThreshold, useMfiFilter, useMovingAvg)
MFI filter for filtering signals based on Money Flow Index
Parameters:
length (int) : The length of the MFI calculation
mfiThreshold (float) : The MFI threshold
useMfiFilter (bool) : Whether to apply the MFI filter
useMovingAvg (bool) : Whether to use moving average as threshold
Returns: Filtered result indicating whether the signal should be used
detect_obv_states(obvThresholdStrong, obvThresholdModerate, lookbackPeriod, obvMode)
detect_obv_states: Identify OBV states with three levels (Strong, Moderate, Weak) over a configurable period
Parameters:
obvThresholdStrong (float) : Threshold for strong OBV movements
obvThresholdModerate (float) : Threshold for moderate OBV movements
lookbackPeriod (int) : Number of periods to analyze OBV trends
obvMode (string) : OBV mode to filter ("Strong", "Moderate", "Weak")
Returns: OBV state ("Strong Up", "Moderate Up", "Weak Up", "Positive Divergence", "Negative Divergence", "Consolidation", "Weak Down", "Moderate Down", "Strong Down")
filter_obv(src, length, obvMode, threshold, useObvFilter, useMovingAvg)
filter_obv: Filter signals based on OBV states
Parameters:
src (float) : The source series (default: close)
length (int) : The length of the OBV moving average calculation
obvMode (string) : OBV mode to filter ("Strong", "Moderate", "Weak")
threshold (float) : Optional threshold for additional filtering
useObvFilter (bool) : Whether to apply the OBV filter
useMovingAvg (bool) : Whether to use moving average as threshold
Returns: Filtered result indicating whether the signal should be used
filter_cmf(length, cmfThreshold, useCmfFilter, useMovingAvg)
CMF filter for filtering signals based on Chaikin Money Flow
Parameters:
length (int) : The length of the CMF calculation
cmfThreshold (float) : The CMF threshold
useCmfFilter (bool) : Whether to apply the CMF filter
useMovingAvg (bool) : Whether to use moving average as threshold
Returns: Filtered result indicating whether the signal should be used
filter_vwap(useVwapFilter)
VWAP filter for filtering signals based on Volume-Weighted Average Price
Parameters:
useVwapFilter (bool) : Whether to apply the VWAP filter
Returns: Filtered result indicating whether the signal should be used
filter_pvt(length, pvtThreshold, usePvtFilter, useMovingAvg)
PVT filter for filtering signals based on Price Volume Trend
Parameters:
length (int) : The length of the PVT moving average calculation
pvtThreshold (float) : The PVT threshold
usePvtFilter (bool) : Whether to apply the PVT filter
useMovingAvg (bool) : Whether to use moving average as threshold
Returns: Filtered result indicating whether the signal should be used
filter_vo(shortLength, longLength, voThreshold, useVoFilter, useMovingAvg)
VO filter for filtering signals based on Volume Oscillator
Parameters:
shortLength (int) : The length of the short-term volume moving average
longLength (int) : The length of the long-term volume moving average
voThreshold (float) : The Volume Oscillator threshold
useVoFilter (bool) : Whether to apply the VO filter
useMovingAvg (bool) : Whether to use moving average as threshold
Returns: Filtered result indicating whether the signal should be used
filter_cho(shortLength, longLength, choThreshold, useChoFilter, useMovingAvg)
CHO filter for filtering signals based on Chaikin Oscillator
Parameters:
shortLength (int) : The length of the short-term ADI moving average
longLength (int) : The length of the long-term ADI moving average
choThreshold (float) : The Chaikin Oscillator threshold
useChoFilter (bool) : Whether to apply the CHO filter
useMovingAvg (bool) : Whether to use moving average as threshold
Returns: Filtered result indicating whether the signal should be used
filter_fi(length, fiThreshold, useFiFilter, useMovingAvg)
FI filter for filtering signals based on Force Index
Parameters:
length (int) : The length of the FI calculation
fiThreshold (float) : The Force Index threshold
useFiFilter (bool) : Whether to apply the FI filter
useMovingAvg (bool) : Whether to use moving average as threshold
Returns: Filtered result indicating whether the signal should be used
filter_garman_klass_volatility(length, useGkFilter)
Parameters:
length (int)
useGkFilter (bool)
filter_frama(src, length, useFramaFilter)
Parameters:
src (float)
length (int)
useFramaFilter (bool)
filter_bollinger_bands(src, length, stdDev, useBollingerFilter)
Parameters:
src (float)
length (int)
stdDev (float)
useBollingerFilter (bool)
filter_keltner_channel(src, length, atrMult, useKeltnerFilter)
Parameters:
src (float)
length (simple int)
atrMult (float)
useKeltnerFilter (bool)
regime_filter(src, threshold, useRegimeFilter)
Regime filter for filtering signals based on trend strength
Parameters:
src (float) : The source series
threshold (float) : The threshold for the filter
useRegimeFilter (bool) : Whether to apply the regime filter
Returns: Filtered result indicating whether the signal should be used
regime_filter_v2(src, threshold, useRegimeFilter)
Regime filter for filtering signals based on trend strength
Parameters:
src (float) : The source series
threshold (float) : The threshold for the filter
useRegimeFilter (bool) : Whether to apply the regime filter
Returns: Filtered result indicating whether the signal should be used
filter_adx(src, length, adxThreshold, useAdxFilter)
ADX filter for filtering signals based on ADX strength
Parameters:
src (float) : The source series
length (simple int) : The length of the ADX calculation
adxThreshold (int) : The ADX threshold
useAdxFilter (bool) : Whether to apply the ADX filter
Returns: Filtered result indicating whether the signal should be used
filter_volatility(minLength, maxLength, useVolatilityFilter)
Volatility filter for filtering signals based on volatility
Parameters:
minLength (simple int) : The minimum length for ATR calculation
maxLength (simple int) : The maximum length for ATR calculation
useVolatilityFilter (bool) : Whether to apply the volatility filter
Returns: Filtered result indicating whether the signal should be used
filter_ulcer(src, length, ulcerThreshold, useUlcerFilter)
Ulcer Index filter for filtering signals based on Ulcer Index
Parameters:
src (float) : The source series
length (int) : The length of the Ulcer Index calculation
ulcerThreshold (float) : The Ulcer Index threshold (default: average Ulcer Index)
useUlcerFilter (bool) : Whether to apply the Ulcer Index filter
Returns: Filtered result indicating whether the signal should be used
filter_stddev(src, length, stdDevThreshold, useStdDevFilter)
Standard Deviation filter for filtering signals based on Standard Deviation
Parameters:
src (float) : The source series
length (int) : The length of the Standard Deviation calculation
stdDevThreshold (float) : The Standard Deviation threshold (default: average Standard Deviation)
useStdDevFilter (bool) : Whether to apply the Standard Deviation filter
Returns: Filtered result indicating whether the signal should be used
filter_macdv(src, shortLength, longLength, signalSmoothing, macdVThreshold, useMacdVFilter)
MACD-V filter for filtering signals based on MACD-V
Parameters:
src (float) : The source series
shortLength (simple int) : The short length for MACD calculation
longLength (simple int) : The long length for MACD calculation
signalSmoothing (simple int) : The signal smoothing length for MACD
macdVThreshold (float) : The MACD-V threshold (default: average MACD-V)
useMacdVFilter (bool) : Whether to apply the MACD-V filter
Returns: Filtered result indicating whether the signal should be used
filter_atr(length, atrThreshold, useAtrFilter)
ATR filter for filtering signals based on Average True Range (ATR)
Parameters:
length (simple int) : The length of the ATR calculation
atrThreshold (float) : The ATR threshold (default: average ATR)
useAtrFilter (bool) : Whether to apply the ATR filter
Returns: Filtered result indicating whether the signal should be used
filter_candle_body_and_atr(length, bodyThreshold, atrThreshold, useFilter)
Candle Body and ATR filter for filtering signals
Parameters:
length (simple int) : The length of the ATR calculation
bodyThreshold (float) : The threshold for candle body size (relative to ATR)
atrThreshold (float) : The ATR threshold (default: average ATR)
useFilter (bool) : Whether to apply the candle body and ATR filter
Returns: Filtered result indicating whether the signal should be used
filter_atrp(length, atrpThreshold, useAtrpFilter)
ATRP filter for filtering signals based on ATR Percentage (ATRP)
Parameters:
length (simple int) : The length of the ATR calculation
atrpThreshold (float) : The ATRP threshold (default: average ATRP)
useAtrpFilter (bool) : Whether to apply the ATRP filter
Returns: Filtered result indicating whether the signal should be used
filter_jma(src, length, phase, useJmaFilter)
Parameters:
src (float)
length (simple int)
phase (float)
useJmaFilter (bool)
filter_cidi(src, rsiLength, shortMaLength, longMaLength, useCidiFilter)
Parameters:
src (float)
rsiLength (simple int)
shortMaLength (int)
longMaLength (int)
useCidiFilter (bool)
filter_rsi(src, length, rsiThreshold, useRsiFilter)
Parameters:
src (float)
length (simple int)
rsiThreshold (float)
useRsiFilter (bool)
filter_ichimoku_oscillator(length, threshold, useFilter)
Ichimoku Oscillator filter for filtering signals based on Ichimoku Oscillator
Parameters:
length (int) : The length of the Ichimoku Oscillator calculation
threshold (float) : The threshold for the filter (default: average Ichimoku Oscillator)
useFilter (bool) : Whether to apply the filter
Returns: Filtered result indicating whether the signal should be used
filter_cmb_composite_index(src, shortLength, longLength, threshold, useFilter)
CMB Composite Index filter for filtering signals based on CMB Composite Index
Parameters:
src (float) : The source series
shortLength (simple int) : The short length for CMB calculation
longLength (simple int) : The long length for CMB calculation
threshold (float) : The threshold for the filter (default: average CMB Composite Index)
useFilter (bool) : Whether to apply the filter
Returns: Filtered result indicating whether the signal should be used
filter_connors_rsi(src, rsiLength, rocLength, streakLength, threshold, useFilter)
Connors RSI filter for filtering signals based on Connors RSI
Parameters:
src (float) : The source series
rsiLength (simple int) : The length for RSI calculation
rocLength (int) : The length for ROC calculation
streakLength (simple int) : The length for streak calculation
threshold (float) : The threshold for the filter (default: average Connors RSI)
useFilter (bool) : Whether to apply the filter
Returns: Filtered result indicating whether the signal should be used
filter_coppock_curve(src, roc1Length, roc2Length, wmaLength, threshold, useFilter)
Coppock Curve filter for filtering signals based on Coppock Curve
Parameters:
src (float) : The source series
roc1Length (int) : The length for the first ROC calculation
roc2Length (int) : The length for the second ROC calculation
wmaLength (int) : The length for the WMA calculation
threshold (float) : The threshold for the filter (default: average Coppock Curve)
useFilter (bool) : Whether to apply the filter
Returns: Filtered result indicating whether the signal should be used
filter_pmo(src, pmoLength, smoothingLength, threshold, useFilter)
DecisionPoint Price Momentum Oscillator filter for filtering signals based on PMO
Parameters:
src (float) : The source series
pmoLength (simple int) : The length for PMO calculation
smoothingLength (simple int) : The smoothing length for PMO
threshold (float) : The threshold for the filter (default: average PMO Oscillator)
useFilter (bool) : Whether to apply the filter
Returns: Filtered result indicating whether the signal should be used
filter_macd(src, shortLength, longLength, signalSmoothing, threshold, useFilter)
MACD filter for filtering signals based on MACD
Parameters:
src (float) : The source series
shortLength (simple int) : The short length for MACD calculation
longLength (simple int) : The long length for MACD calculation
signalSmoothing (simple int) : The signal smoothing length for MACD
threshold (float) : The threshold for the filter (default: average MACD)
useFilter (bool) : Whether to apply the filter
Returns: Filtered result indicating whether the signal should be used
filter_macd_histogram(src, shortLength, longLength, signalSmoothing, threshold, useFilter)
MACD-Histogram filter for filtering signals based on MACD-Histogram
Parameters:
src (float) : The source series
shortLength (simple int) : The short length for MACD calculation
longLength (simple int) : The long length for MACD calculation
signalSmoothing (simple int) : The signal smoothing length for MACD
threshold (float) : The threshold for the filter (default: average MACD-Histogram)
useFilter (bool) : Whether to apply the filter
Returns: Filtered result indicating whether the signal should be used
filter_kst(src, r1, r2, r3, r4, sm1, sm2, sm3, sm4, signalLength, threshold, useFilter)
Pring's Know Sure Thing filter for filtering signals based on KST
Parameters:
src (float) : The source series
r1 (int) : The first ROC length
r2 (int) : The second ROC length
r3 (int) : The third ROC length
r4 (int) : The fourth ROC length
sm1 (int) : The first smoothing length
sm2 (int) : The second smoothing length
sm3 (int) : The third smoothing length
sm4 (int) : The fourth smoothing length
signalLength (int) : The signal line smoothing length
threshold (float) : The threshold for the filter (default: average KST Oscillator)
useFilter (bool) : Whether to apply the filter
Returns: Filtered result indicating whether the signal should be used
filter_special_k(src, r1, r2, r3, r4, sm1, sm2, sm3, sm4, threshold, useFilter)
Pring's Special K filter for filtering signals based on Special K
Parameters:
src (float) : The source series
r1 (int) : The first ROC length
r2 (int) : The second ROC length
r3 (int) : The third ROC length
r4 (int) : The fourth ROC length
sm1 (int) : The first smoothing length
sm2 (int) : The second smoothing length
sm3 (int) : The third smoothing length
sm4 (int) : The fourth smoothing length
threshold (float) : The threshold for the filter (default: average Special K)
useFilter (bool) : Whether to apply the filter
Returns: Filtered result indicating whether the signal should be used
filter_roc_momentum(src, rocLength, momentumLength, threshold, useFilter)
ROC and Momentum filter for filtering signals based on ROC and Momentum
Parameters:
src (float) : The source series
rocLength (int) : The length for ROC calculation
momentumLength (int) : The length for Momentum calculation
threshold (float) : The threshold for the filter (default: average ROC and Momentum)
useFilter (bool) : Whether to apply the filter
Returns: Filtered result indicating whether the signal should be used
filter_rrg_relative_strength(src, length, threshold, useFilter)
RRG Relative Strength filter for filtering signals based on RRG Relative Strength
Parameters:
src (float) : The source series
length (int) : The length for RRG Relative Strength calculation
threshold (float) : The threshold for the filter (default: average RRG Relative Strength)
useFilter (bool) : Whether to apply the filter
Returns: Filtered result indicating whether the signal should be used
filter_alligator(useFilter)
Parameters:
useFilter (bool)
filter_wyckoff(useFilter)
Parameters:
useFilter (bool)
filter_squeeze_momentum(bbLength, bbStdDev, kcLength, kcMult, useFilter)
Parameters:
bbLength (int)
bbStdDev (float)
kcLength (simple int)
kcMult (float)
useFilter (bool)
filter_atr_compression(length, atrThreshold, useFilter)
Parameters:
length (simple int)
atrThreshold (float)
useFilter (bool)
filter_low_volume(length, useFilter)
Parameters:
length (int)
useFilter (bool)
filter_nvi_accumulation(useFilter)
Parameters:
useFilter (bool)
filter_ma_slope(src, length, slopeThreshold, useFilter)
Parameters:
src (float)
length (int)
slopeThreshold (float)
useFilter (bool)
filter_adx_low(len, lensig, adxThreshold, useFilter)
Parameters:
len (simple int)
lensig (simple int)
adxThreshold (int)
useFilter (bool)
filter_choppiness_index(length, chopThreshold, useFilter)
Parameters:
length (int)
chopThreshold (float)
useFilter (bool)
filter_range_detection(length, useFilter)
Parameters:
length (int)
useFilter (bool)

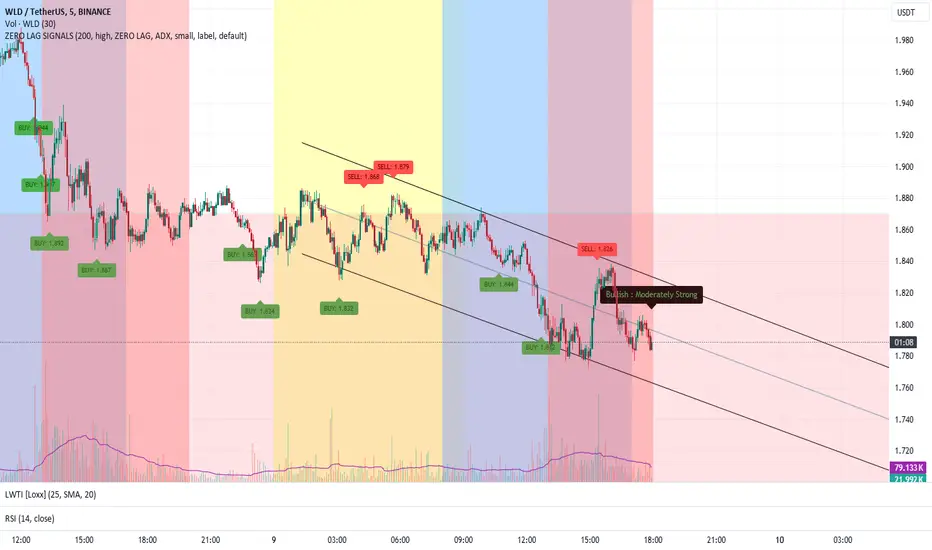
ZERO LAG TRADE SIGNALS by BootcampZeroThe ZERO LAG TRADE SIGNALS by BootcampZero indicator is a versatile tool designed to help traders identify optimal entry and exit points for both short-term scalping and long-term trading across multiple time frames. It combines several well-known technical analysis methods, including moving averages, trend analysis, directional indicators, and adaptive trend calculations, to deliver reliable buy and sell signals.
Short-Term Scalping (Under 5-Minute Time Frames)
For short-term traders who prefer quick trades on lower time frames, such as under 5 minutes, this indicator uses a combination of the EMA (Exponential Moving Average) and SMA (Simple Moving Average) to spot fast trend reversals. The indicator is particularly useful for scalpers because it focuses on detecting short-term price momentum by comparing the faster-moving averages with slower ones, triggering signals based on their crossover.
Buy Signals are generated when a fast-moving EMA crosses above a slower-moving SMA, indicating upward momentum.
Sell Signals are triggered when the fast-moving EMA crosses below the slower-moving SMA, signaling potential downward price movement.
In addition, the Adaptive Trend Finder feature dynamically adjusts to recent price deviations and volatility, making it easier for scalpers to spot the prevailing short-term trend with high confidence. The indicator also uses ADX (Average Directional Index) for momentum confirmation, ensuring that signals are only generated during strong price trends, reducing false positives in sideways markets.
Long-Term Trading (Above 1-Day Charts)
When applied to higher time frames such as daily charts or above, this indicator excels in generating reliable long-term buy and sell signals, perfect for swing traders and long-term investors. The Kaufman Adaptive Moving Average (KAMA) and the Ichimoku Cloud are used to assess long-term trends by filtering out market noise and focusing on sustainable price direction.
KAMA helps to adapt the moving average based on market volatility, providing smoother signals that minimize whipsawing in longer-term trades.
Ichimoku Cloud provides additional trend confirmation by identifying whether the market is bullish or bearish based on the relationship between key lines like the Tenkan-Sen (Conversion Line) and Kijun-Sen (Base Line), and how the current price interacts with the Ichimoku Cloud itself.
The indicator also integrates PPO (Percentage Price Oscillator) to capture divergences between price and momentum, further supporting traders in holding positions for extended periods when the signal strength is robust.
Key Technical Values and Factors for Signals
EMA and SMA Crossover: Fast EMA vs. Slow SMA to detect short-term trend reversals.
ADX: Helps gauge the strength of the trend; signals are only generated in trending markets.
KAMA: Filters noise in long-term trends, providing smooth signals based on market volatility.
Ichimoku Cloud: Offers insight into long-term trends and momentum by analyzing price relative to the cloud.
PPO: Detects divergences between price and momentum for trend continuation or reversal signals.
How It Works
Buy signals are generated when bullish conditions are met, and the indicator confirms momentum with ADX, crossover of the EMAs, or a bullish breakout from the Ichimoku Cloud.
Sell signals are triggered when bearish conditions prevail, confirmed by the same factors in reverse, such as a bearish EMA crossover or weakness in ADX.
By combining these powerful tools, ZERO LAG TRADE SIGNALS by BootcampZero offers traders a comprehensive system for both quick scalping trades and more conservative long-term positioning, providing reliable and adaptive signals across different market conditions.
DILM TRADING - Market Sentiment and FibonacciDILM TRADING - Market Sentiment and Fibonacci
Overview
The DILM TRADING - Market Sentiment and Fibonacci indicator is designed to provide traders with a comprehensive view of market trends and potential trading opportunities. By combining several popular technical indicators such as the SuperTrend, Fibonacci levels, and multiple sentiment indicators, this tool offers a deep analysis of market dynamics. Each component has been carefully selected to work in harmony, providing users with reliable entry and exit signals and helping them navigate volatile markets.
Why This Combination?
This indicator brings together different elements with specific purposes:
SuperTrend: A trend-following indicator that helps identify the market's current direction and acts as a dynamic stop-loss tool.
Fibonacci Levels: Known for pinpointing potential market reversal points, these levels provide crucial support and resistance areas for traders to set stop-losses and take-profits.
Sentiment Indicators: Tools like RSI, MACD, and Ichimoku are combined to gauge market momentum, allowing traders to assess whether a market is overbought or oversold, and whether the current trend is strong enough to continue or reverse.
The combination of these indicators gives traders a complete framework for analyzing the market: trend direction, market sentiment, and key price levels. Each of these elements works in tandem to provide signals that are both timely and accurate.
Key Features
SuperTrend
Based on the Average True Range (ATR), the SuperTrend indicator is an excellent way to determine the current trend. If the price is above the SuperTrend line, it suggests an uptrend, whereas if the price is below it, a downtrend is indicated. It is also a highly effective tool for setting trailing stop-losses, thereby improving risk management.
Fibonacci Levels
The script automatically calculates Fibonacci retracement levels based on the highest and lowest points within a specific timeframe. These levels are essential for identifying potential reversal zones, key areas for stop-losses, and take-profit levels. The levels adjust according to the prevailing trend, making them a dynamic and responsive tool for any market condition.
Sentiment Indicators
This section integrates multiple sentiment indicators to give a holistic view of market direction:
Ichimoku Cloud: Measures the strength of trends and identifies potential reversal zones using clouds (Kumo).
OBV (On-Balance Volume): Tracks volume changes to confirm the direction of price movements.
CMF (Chaikin Money Flow): Monitors the money flow to identify buying or selling pressure.
RSI (Relative Strength Index): Highlights overbought or oversold conditions, signaling potential trend reversals.
MACD: A reliable tool for identifying bullish and bearish crossovers.
ADX (Average Directional Index): Determines the strength of the prevailing trend, helping to confirm whether it's likely to continue or weaken.
Volatility Filter
The ATR (Average True Range) acts as a filter to identify periods of high or low volatility, helping traders to adapt their strategies to the current market environment. High volatility suggests larger price swings, potentially offering better trading opportunities, while low volatility indicates consolidation or range-bound conditions.
Order Blocks
The script visually identifies bullish and bearish order blocks on the chart. These zones represent areas where significant buying or selling occurred, making them crucial for spotting potential breakout or reversal points.
How to Use
Entry/Exit: Fibonacci levels (50% or 61.8%) serve as potential entry points, while the 0% and 100% levels can be used to set take-profit and stop-loss levels.
Sentiment Analysis: The overall market sentiment is derived from the combination of Ichimoku, OBV, CMF, RSI, ADX, and other tools, helping traders make informed decisions on whether to buy or sell.
Risk Management: Use SuperTrend and Fibonacci levels to set precise stop-loss points and improve risk management.
New Feature: Moving Average and RSI Confirmation
A recent addition allows users to calculate two moving averages (short and long) and the RSI on a timeframe of their choice. An entry signal is generated when the short moving average crosses above the long, and the RSI is below a specific threshold. Conversely, a sell signal is displayed when the short moving average crosses below the long, and the RSI is above a defined level.
Limitations
This indicator may be less effective during periods of low volatility or range-bound markets. It's important to use this tool in conjunction with other analysis techniques, as relying on a single indicator could lead to false signals.
DILM TRADING - Sentiment de marché et Fibonacci
Vue d'ensemble
L'indicateur DILM TRADING - Sentiment de marché et Fibonacci a été conçu pour offrir une vue d'ensemble des tendances du marché et des opportunités de trading potentielles. En combinant plusieurs indicateurs techniques populaires, tels que le SuperTrend, les niveaux de Fibonacci, et divers indicateurs de sentiment, cet outil fournit une analyse complète des dynamiques du marché. Chaque composant a été soigneusement sélectionné pour fonctionner ensemble, offrant des signaux d'entrée et de sortie fiables.
Pourquoi cette combinaison ?
Cette combinaison d'indicateurs permet de fournir un cadre complet pour analyser le marché. Le SuperTrend permet d'identifier la tendance, tandis que les niveaux de Fibonacci aident à déterminer les zones de retournement clés. Les indicateurs de sentiment, comme le RSI et le MACD, ajoutent une dimension supplémentaire en mesurant la force et la direction du marché.
Caractéristiques clés et Utilisation
SuperTrend : Indique la tendance actuelle et propose des niveaux de stop-loss dynamiques.
Niveaux de Fibonacci : Utilisés pour repérer des points de retournement potentiels et définir des niveaux de stop-loss et de take-profit.
Indicateurs de Sentiment : Outils comme l'Ichimoku, le RSI, et l'ADX fournissent une analyse globale du marché, permettant de prendre des décisions éclairées.
Nouvelle fonctionnalité : Confirmation des Moyennes Mobiles et RSI
Cette fonctionnalité permet d'utiliser deux moyennes mobiles et le RSI pour générer des signaux d'achat et de vente basés sur les croisements et les niveaux de surachat/survente du RSI.
Conclusion
Le DILM TRADING - Sentiment de marché et Fibonacci est un outil puissant et polyvalent, conçu pour les traders cherchant à affiner leurs stratégies grâce à une analyse complète des tendances et du sentiment du marché.

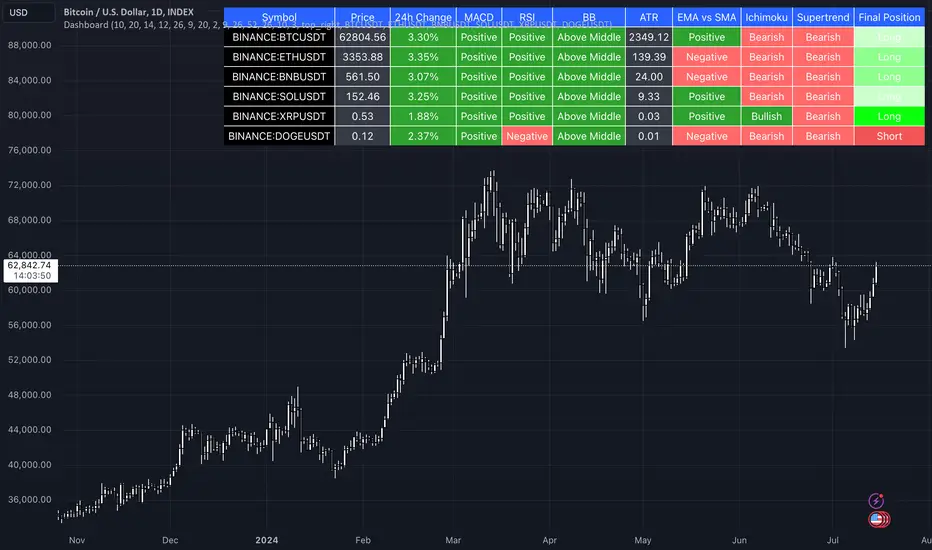
Uptrick: Comprehensive Market Sentiment DashboardIntroducing "Uptrick: Comprehensive Market Sentiment Dashboard"—an advanced trading indicator designed to provide traders with a complete and detailed overview of market conditions for multiple assets at a glance. This sophisticated tool is engineered to enhance your trading decisions by consolidating key technical indicators into a single, easy-to-read dashboard. Perfect for both novice and experienced traders, the Uptrick Dashboard is built to offer a competitive edge in the dynamic world of trading.
### Purpose
The primary goal of the Uptrick Dashboard is to equip traders with a powerful, all-in-one solution that streamlines market analysis. By combining multiple technical indicators and presenting their outputs in a cohesive format, this dashboard eliminates the need to toggle between different charts and tools. It delivers a clear, immediate understanding of market sentiment across various assets, enabling faster and more informed trading decisions.
### Features and Inputs
The Uptrick Dashboard integrates several widely-used technical indicators, each customizable to fit your specific trading strategy. Here’s a detailed breakdown of the features and input parameters:
1. **Exponential Moving Average (EMA)**
- **Input Parameter:** EMA Length
- **Purpose:** Tracks the asset’s price trend by smoothing out price data over a specified period.
2. **Simple Moving Average (SMA)**
- **Input Parameter:** SMA Length
- **Purpose:** Provides a simpler, more straightforward calculation of price trends compared to EMA.
3. **Relative Strength Index (RSI)**
- **Input Parameter:** RSI Length
- **Purpose:** Measures the magnitude of recent price changes to evaluate overbought or oversold conditions.
4. **Moving Average Convergence Divergence (MACD)**
- **Input Parameters:** MACD Fast Length, MACD Slow Length, MACD Signal Length
- **Purpose:** Identifies changes in the strength, direction, momentum, and duration of a trend.
5. **Bollinger Bands (BB)**
- **Input Parameters:** BB Length, BB StdDev
- **Purpose:** Provides a visual representation of volatility and relative price levels over a specified period.
6. **Ichimoku Cloud**
- **Input Parameters:** Ichimoku Tenkan Length, Ichimoku Kijun Length, Ichimoku Span A Length, Ichimoku Span B Length
- **Purpose:** Offers a comprehensive view of support and resistance levels, momentum, and trend direction.
7. **Supertrend**
- **Input Parameters:** Supertrend ATR Length, Supertrend Multiplier
- **Purpose:** Combines trend direction and volatility to provide buy and sell signals.
8. **Symbols Input**
- **Input Parameter:** Symbols (comma separated)
- **Purpose:** Allows users to specify and monitor multiple assets simultaneously.
### Customization and Flexibility
Each indicator within the Uptrick Dashboard is fully customizable, allowing you to adjust parameters to align with your trading strategy. Whether you prefer short-term trading with faster indicators or long-term analysis with slower, more reliable data, this dashboard can be tailored to meet your needs.
### Key Differentiators
What sets the Uptrick Dashboard apart from other market sentiment tools is its unparalleled integration of multiple technical indicators into a single, comprehensive view. This consolidation not only saves time but also provides a more holistic understanding of market conditions. Here’s what makes the Uptrick Dashboard unique:
- **Integrated Analysis:** Combines multiple indicators to provide a unified market sentiment.
- **Customizable Inputs:** Each indicator can be adjusted to suit your specific trading strategy.
- **Multi-Asset Monitoring:** Track and analyze several assets simultaneously.
- **User-Friendly Interface:** Designed for ease of use, presenting data in an organized, visually appealing format.
- **Real-Time Updates:** Continuously updates to reflect the latest market data.
### Future Updates
We are committed to continually improving the Uptrick Dashboard to ensure it remains a valuable tool in your trading arsenal. Users can expect regular updates that will introduce new features, enhance existing functionalities, and incorporate user feedback. Future updates may include:
- **Additional Indicators:** Introducing new technical indicators to provide even deeper insights.
- **Enhanced Visualization:** Improved graphical representations for better data interpretation.
- **Automation Features:** Tools to automate certain trading strategies based on indicator outputs.
- **User Customization:** More options for personalizing the dashboard to fit individual preferences.
### How It Works
The Uptrick Dashboard operates by calculating key technical indicators for each specified asset and displaying the results in a neatly organized table. Here’s a closer look at how it works:
1. **Input Parameters:** Users input their preferred settings for each indicator, including the list of assets to monitor.
2. **Data Retrieval:** The dashboard retrieves real-time market data for each specified asset.
3. **Indicator Calculation:** Using the input parameters, the dashboard calculates the values for each technical indicator.
4. **Visual Display:** Results are displayed in a table format, highlighting key information such as price, 24-hour change, and sentiment indicators (e.g., MACD, RSI, Bollinger Bands).
5. **Final Position:** The dashboard calculates an overall market position (Long, Short, or Neutral) based on the combined outputs of the individual indicators.
### Conclusion
The "Uptrick: Comprehensive Market Sentiment Dashboard" is a must-have tool for traders seeking a streamlined, efficient way to monitor market conditions across multiple assets. By integrating essential technical indicators into a single, customizable dashboard, it provides a comprehensive view of market sentiment, facilitating quicker and more informed trading decisions. Stay ahead of the market with Uptrick and experience the difference that a well-designed, all-in-one trading tool can make.
With regular updates and a commitment to excellence, the Uptrick Dashboard is poised to evolve continually, adapting to the changing needs of traders and the dynamics of the market. Whether you’re a seasoned trader or just starting out, the Uptrick Dashboard offers the insights and flexibility needed to enhance your trading strategy. Invest in the Uptrick Dashboard today and take your trading to the next level.
Crypto Tipster v2---------------------
Crypto Tipster v2
Hello again! We're back with a drastically improved Crypto Tipster v2 Indicator using over a dozen all new algorithms based around Technical Analysis, Price Action, Momentum Swings and Reversal Detection.
We've taken our time with version 2 of Crypto Tipster, putting all our best practices to work and ensuring it performs superbly across numerous crypto markets and timeframes - we have focused our efforts towards the larger timeframes, 12H, 1D, 2D for example as we believe these to be the most consistent and predictable, and therefore the most profitable.
Trading on longer timeframes also reduces the overal cost of trading fee's as you'll be placing fewer trades over any given time period, whilst catching bigger swings and therefore earning a higher percentage per winning trade. Due to these bigger price swings you can de-leverage your trades too, making them inherintly safer and more controlled.
The final benefit to placing trades on longer timeframes is that you will not be tied down to your PC or laptop for hours on end waiting for a perfect entry or exit point, which increases the odds of placing bad/panic trades or even placing trades due to boredom! If you trade with Crypto Tipster v2 on a 1D timeframe, you will only ever have work to do once per day, at bar close; this is when trades are placed or exited, or stop losses/take profits are updated to new levels - easy!
Crypto Tipster v2 can help consistently catch tops and bottoms of trending markets whilst avoiding placing trades through choppy or ranging areas, this helps to not only maximise profits (what we're all after!) but also to minimise losses (equally important). We've tirelessly tested Crypto Tipster using literally thousands of variables across dozens of built-in algorithms over hundreds of trading pairs - lots of data to process!
The outcome is rather stunning and well worth checking out - we're rather proud of what we've achieved here, and we're pretty sure you're going to love it too!
---------------------
What's Included
- Chart Settings
The first section you'll come across, Chart Settings.
Here you'll find a few options regarding how your chosen market chart will look within TradingView and how Crypto Tipster will interact with this chart.
One of the most important Tick boxes is first on the list - "Show Backtest Results". This will change Crypto Tipster from displaying simple but easy-to-follow "Buy/Sell" labels into Strategy mode in which you can set up more complicated Stop Loss / Take profit settings as well as setting up Alerts for auto trading and other more complex functions (see How It Works for more info!
We've also included a "Trend Strength Bar Color" tick box which changes the color of the chart bars based on how strong Crypto Tipster is perceiving the current trend and in which direction.
- Trend Settings
"Trading Frequency" represents how often Crypto Tipster will be looking for a new trend / change in trend direction, and therefore how often it will be placing trades. By default this is set to "Normal" but can be changed to "Rapid" using the drop down menu.
"Entry Trend Strength" also determines how frequently trades are placed by selecting the strength of trend required before a trade is placed. The scale ranges from "1-5", with 1 being a low trend strength required, 5 being a very strong trend strength required.
Within the Trend Settings section you'll also find an "Avg Trend Strength over Bars" option. This allows you to average (mean) the current trend strength over a pre-determined amount (1-5) of previous chart bars - thus providing a potentially more consistent signal.
- Trade Settings
Trade Settings help Crypto Tipster determine what type of trades you're looking to place.
The overall "Trade Direction" will decide to either target only Long trades, only Short trades, or Both (default).
"Consecutive Trades in Same Direction" allows for pyramiding - whereby you can specify to allow for multiple trades of the same direction. Set to "1" as default allows for no extra pyramiding, max setting of "10".
- Trade Protection
Currently consisting of two functions, our Trade Protection section can help to achieve both the removal of false signals (whipsaws), and the extension of good trades without confusion during minor retracements.
"Chop Removal" can help to remove some whipsaw trades during ranging market conditions, therefore improving overal profitability by only targeting stronger trends. You have an option to choose from either "Weak" or "Strong" Chop Removal.
"Protection Filter" uses current trading criteria as defined by you, and uses it to check against a higher time frame than you're currently viewing. This can help to eliminate some bad trades at the expense of a potential lag on good trades.
- Stop Loss / Take Profit
Stop Losses should be a crucial aspect of everyone's trading system. They help prevent any trade from going too far in the wrong direction and limit losses.
Our "Stop Loss (%)" is quick and easy to set up, simply set the percentage offset from the entry price of trades and a fixed Stop Loss will be in place on all trades.
"Take Profit (%)" works in the same way as the Stop Loss mentioned above - simply set the percentage you'd like to exit a profitable trade at.
The "Trailing Stop (%)" is a little more complicated in that it will follow the trend of the trade a certain percentage away from the current market price - this is great for keeping yourself in a trade for as long as the trade is moving in the right direction.
- Extra Tools & Indicators
This is the section of Crypto Tipster that enables you to add some chart visuals to assist you with your preferred trading style.
"Potential Pivot Points" are not the same as actual pivot points - Potential pivot points will paint on the chart at bar close, giving you an immediate alert to potential tops/bottoms of market trends. You can choose to display only the strongest potential points, or include some of the weaker signals too.
"Actual Pivot Points" are inherintly more accurate than Potential pivot points, but do not paint on the chart until after a pre-determined amount of time has passed. These are great for placing stop losses/take profits or watching the market for breakouts or reversals.
"Support/Resistance Levels" plots up to 6 support and resistance horizontal lines based on recent price tops/bottoms. Use these to determine areas where price could rebound or break-through.
"Bollinger Band Breakout" - Bollinger bands are a tried and tested technical analysis tool, similar to pivot points and support/resistance lines, thee are another great tool to determine where price may retrace, consolidate or breakout.
- Ichimoku Cloud
Somewhat confusing and intimidating when you first come across this technical analysis indicator, the "Ichimoku Cloud" is one of our favorites. Assisting with the detection of Dynamic Support and Resistance levels, Momentum and Trend Direction all in one super indicator.
Although certain aspects of the Ichimoku Cloud are already present within Crypto Tipster v2 algorithms in order to offer you the best possible signals, we've also included a user-definable section of it's own so you can manually set up and use the cloud for your own trading needs, all cloud signals (and there are many) are available to set up as Alerts for your own needs or an Auto-Trading Bot.
- Custom Alerts for Any Signal
We've endeavoured to ensure that all signals, not just the Buy/Sell signals, are ready and available to create Alerts with; giving you the most opportunity to create a fully custom trading engine that suits your exact trading requirements.
This means you can set Alerts for any and all signals you can see on the chart when using Crypto Tipster v2, this includes Buy/Sell Signals, Trend Strength Signals, Choppy Market Signals, Stop Loss/Take Profit Signals, Pivot Points, S/R levels crossed above & below, Bollinger Band Breakout and several Ichimoku Cloud Signals.. the list goes on!
---------------------
We've tried to make Crypto Tipster as comprehensive and easy to understand as possible, we are however always in search of progression; we do really love to hear your feedback :)
For more information and a free 8-day trial please visit the link in our signature
Happy Trading Guys

Golden trend alertHI there,
This is indcator support to manage trend of market better.
I would summarize this function as below :
1/ Define golden trend of market by ichimoku.
2/ Able to manage 19 assets at the same time.
3/ Alert to you whenever signal come in. Alert by Email, notifications ..etc.. based on your setting.
Guidance to use :
1/To change the asset you monitor, you can double click on indicator --> Change the assets from "Sy01" --> "Sy19" into your target.
2/ To change to period you monitor, you can double click on indicator --> Change the Surveyed timeframe as below :
1 --> 1 minute timeframe
240 --> 4H timeframe
1D --> Daily timeframe
1W --> Weekly timeframe
1M --> Monthly timeframe
How signals were describeb on the chart
1/ Up-green arrow : Golden trend for up trend
2/ Down-red arrow : Golden trend for down trend
Hope my indicator help you manage porfolio better.
Regards,
Jayce pHAM

Supertrend GoldSignalThis indicator is a combination of two atr with numbers 1.6 and 0.8
The signals that are displayed on the chart are the points where both atr signaled at the same time (if distance = 0).
-The atr1 check box is only for displaying atr signals with the number 1.6. You can choose the atr1 number in the slow multiplier section.
-The atr2 check box is only for displaying atr signals with a number of 0.8. You can select the number of atr2 in the fast multiplier section.
-Note: If the atr1 and atr2 checkboxes are off, only simultaneous signals will be displayed on the chart (that is, points where atr1 and atr2 signaled at the same time).
-In the distance section, you can specify the distance between the atr1 and atr2 signals, if it is zero, it means that the atr1 and atr2 signals must be given on the same candle.
For example, if the value of distance is 5, it means that atr1 and atr2 signals can have a distance of 5 candles.
-The filter check box is for filtering signals using boxes 9, 26 and 52 in Ichimoku.
At the points where we have signals, boxes of 9 candles, 26 candles and 52 candles are drawn, and for long signals, the bottom of the boxes must be equal, and for short signals, the top of the boxes must be equal,Signals that do not meet this condition are removed.

The Ultimate Backtest - Fontiramisu█ OVERVIEW
The Ultimate Backtest allows you to create an infinite number of trading strategies and backtest them easily and quickly.
You can leverage the trading setup you created with the tradingview's real-time alert system.
The tool is constantly being improved to accommodate more in-house indicators in order to imagine more trading strategies.
█ HOW IT WORKS.
The tool is divided into 3 main parts:
1. The indicators:
These are the indicators that you will be able to set up to create your setups.
Example: rsi, exponential moving average, home made resistance/support indicator etc.
We are working to add more and more in-house indicators to multiply the trading strategies.
2. The entry/exit strategy:
The entry/exit trades management is a central point of the strategy.
Here we propose several ways to take profits and in-house optimizations to enter a position.
3. The setup: the combination of indicators
Here it is up to you to create your own recipe.
You combine the different indicators set up above to make a real strategy.
Example: RSI Divergence + Location on a support.
Let's look at this in more detail.
Below is a description of all sections
█ 1. THE INDICATORS
TREND: MA (moving average) -->
Set up a moving average from multiple methods (sma, ema, smma...) of the type and length you want.
> A long is taken if the price is above the MA.
> A short is taken if the price comes below the MA.
You can set up a smoothing MA from the existing moving average and use it in the same way.
ENVELOPE: SUPER TREND -->
The supertrend is a trend following indicator. It clearly describes the distinction between downtrends and uptrends with a red or green direction. It is calculated according to the ATR and a factor.
> A long is taken when the direction is green and the price touches the supertrend support line.
> A short is taken when the direction is red and the price touches the supertrend resistance line.
ENVELOPE: BOLLINGER BAND -->
Bollinger bands are used to evaluate the volatility and probable evolution of prices, here we exploit the envelope
> A long is taken if the price crosses the lower band.
> A short is taken if the price crosses the upper band.
CLOUD: ICHIMOKU -->
The Ichimoku cloud aims to identify the direction and reversal points of dominant market trends. It displays support and resistance levels.
> A long is taken when the price enters the green ichimoku cloud.
> A short is taken when the price enters the red ichimoku cloud.
MOMENTUM: MACD ZERO LAG / MACD / RSI -->
RSI (Relative Strength Index) reflects the relative strength of upward movements, compared to downward movements.
MACD (Moving Average Convergence Divergence) is a momentum indicator that follows the trend and shows the correlation between two moving averages of the asset price.
MACD ZERO LAG is calculated in the same way except that the exponential moving averages that make up the calculation do not lag.
> A long is taken on a potential bullish divergence.
> A short is taken on a potential bearish divergence.
For now, with these indicators, we only take a trade based on divergences but we will add overbuy/oversell etc.
MOMENTUM: MA SLOPE -->
This house indicator allows you to use the slope of a moving average as a measure of momentum.
Define the length of the moving average whose slope we will take.
We then take a fast ma of the slope then a slow ma (You define the lengths with the parameters)
The tool foresees a subtraction between the slow and fast ma to have another interpretation of the slope.
This indicator is available and can be viewed freely on my tradingview profile.
> A long is taken when there is a potential bullish divergence on the fast/slow MA or the difference.
> A short is taken when there is a potential bear divergence on the fast/slow MA or the difference.
RESISTANCE: R/S FONTIRAMISU -->
An in-house indicator that shows resistances and supports according to the chosen parameters.
Indicator available and can be viewed freely on my tradingview profile.
> A long is taken when the price arrives on a support.
> A short is taken when the price arrives on a resistance.
-----
MOMENTUM DIVERGENCE -->
Section used to set the divergence detection.
The first field allows you to select which momentum you want to calculate the divergence on.
PIVOT DETECTION -->
Used to calculate top and dip on the chart, it is used with divergences/resistances/enter-exit optimizations....
Default parameters are: Deviation: 2.5, Depth: 10.
█ 2. STRATEGY FOR ENTERING/EXITING TRADES.
STRATEGY: TP/SL -->
Enter/Exit Trade Mode" field: The first field allows you to choose between two modes:
1. TP/SL Mode:
This mode allows you to take entries with take profits that you define afterwards with the TP1 and TP2 parameters .
> The stop loss is calculated automatically by taking the last dip if it is a long and the last top if it is a short.
> You can add a "Stop Loss % Offset" which will increase the size of the stop loss by the % value you set.
> If you activate TP2, the profit taking is split between TP1 and TP2, you can select the percentage of profit taking split between TP1 and TP2 via the "Percent Exit Profit TP1" field.
> The "TPX Multiplier" fields allow you to define the desired Risk Reward, if = 1 then RR = 1/1.
> A Trailing stop option is available, if active then the profit take will be split between TP1 and Trailing stop.
For the moment you can choose between the two MA's set up above to serve as trailing stop:
> In long, if the price goes below the MA then you take the profit (or the loss)
> In short, if the price goes above the MA then you take the profit (or the loss)
2. ONLY BUY/SELL:
Here the take profits are not taken into account, we only have an alternation between the long and the shorts.
The trailing stop applies to this mode and can be interesting depending on the use.
STRATEGY: SETUP OPTIMIZER (FP) -->
Here we have 3 home made optimization tools to take more relevant trades.
1. FAVORABLE ENTRY FROM PIVOT.
Here the tool will favor entries with interesting locations depending on dips and tops before.
A red cross with "FP" will appear on the chart each time a trade does not meet this condition.
2.STOP LOSS MAX (SL).
Will only take trades where the stop loss is maximum at X%.
A red cross with "%SL" will appear on the chart each time a trade does not meet this condition.
3. MOVE ALREADY TRADED.
Will not take several trades in the same move.
This can avoid cascading losing trades on some setups.
A red cross with "MT" will appear on the chart each time a trade does not meet this condition.
█ 3. THE SETUP: THE COMBINATION OF INDICATORS
Here, let your creativity speak.
You are free to assemble the indicators in the following way:
The conditions defined inside a group (group1/group2/group3) are combined to each other via an OR operator .
Example, if "cond01 = Momentum DIv" and "cond02 = Res/Sup Location", then trades will be triggered if one of the two conditions is met.
The conditions defined between several groups are multiplied via the AND operator .
Example, if "cond01 = Momentum DIv" and "cond12 = Res/Sup Location", then trades are taken if both conditions are met at the same time.
ALL CONDITIONS:
> NONE
No conditions selected.
> Momentum Div
Triggers when a potential divergence occurs on the selected momentum (in the divergence section).
> Momentum Div UT Sup
Triggers when a potential divergence occurs on the selected momentum (in the divergence section) in the upper timeframe.
The upper timeframe of the momentum is calculated directly in the code by multiplying the set parameters by 4 (fastlenght/slowlenght...).
> Multi MA
It is set in the "Trend: MA" section and is triggered by the conditions mentioned in the "INDICATORS" section.
> Smooting MA
Is set in the "Trend: MA" section and is triggered by the conditions mentioned in the "INDICATORS" section.
> Super Trend Env
Is set in the "ENVELOPE: SUPER TREND" section and is triggered by the conditions mentioned in the "INDICATORS" section.
> BB Env
It is set in the "ENVELOPE: BOLLINGER BAND" section and is triggered by the conditions mentioned in the "INDICATORS" section.
> Ichimoku Cloud
Is set in the "CLOUD: ICHIMOKU" section and is triggered by the conditions mentioned in the "INDICATORS" section.
> Res/Sup Location
Is set in the "RESISTANCE: R/S" section and is triggered by the conditions mentioned in the "INDICATORS" section.

pandas_taLibrary "pandas_ta"
Level: 3
Background
Today is the first day of 2022 and happy new year every tradingviewers! May health and wealth go along with you all the time. I use this chance to publish my 1st PINE v5 lib : pandas_ta
This is not a piece of cake like thing, which cost me a lot of time and efforts to build this lib. Beyond 300 versions of this script was iterated in draft.
Function
Library "pandas_ta"
PINE v5 Counterpart of Pandas TA - A Technical Analysis Library in Python 3 at github.com
The Original Pandas Technical Analysis (Pandas TA) is an easy to use library that leverages the Pandas package with more than 130 Indicators and Utility functions and more than 60 TA Lib Candlestick Patterns.
I realized most of indicators except Candlestick Patterns because tradingview built-in Candlestick Patterns are even more powerful!
I use this to verify pandas_ta python version indicators for myself, but I realize that maybe many may need similar lib for pine v5 as well.
Function Brief Descriptions (Pls find details in script comments)
bton --> Binary to number
wcp --> Weighted Closing Price (WCP)
counter --> Condition counter
xbt --> Between
ebsw --> Even Better SineWave (EBSW)
ao --> Awesome Oscillator (AO)
apo --> Absolute Price Oscillator (APO)
xrf --> Dynamic shifted values
bias --> Bias (BIAS)
bop --> Balance of Power (BOP)
brar --> BRAR (BRAR)
cci --> Commodity Channel Index (CCI)
cfo --> Chande Forcast Oscillator (CFO)
cg --> Center of Gravity (CG)
cmo --> Chande Momentum Oscillator (CMO)
coppock --> Coppock Curve (COPC)
cti --> Correlation Trend Indicator (CTI)
dmi --> Directional Movement Index(DMI)
er --> Efficiency Ratio (ER)
eri --> Elder Ray Index (ERI)
fisher --> Fisher Transform (FISHT)
inertia --> Inertia (INERTIA)
kdj --> KDJ (KDJ)
kst --> 'Know Sure Thing' (KST)
macd --> Moving Average Convergence Divergence (MACD)
mom --> Momentum (MOM)
pgo --> Pretty Good Oscillator (PGO)
ppo --> Percentage Price Oscillator (PPO)
psl --> Psychological Line (PSL)
pvo --> Percentage Volume Oscillator (PVO)
qqe --> Quantitative Qualitative Estimation (QQE)
roc --> Rate of Change (ROC)
rsi --> Relative Strength Index (RSI)
rsx --> Relative Strength Xtra (rsx)
rvgi --> Relative Vigor Index (RVGI)
slope --> Slope
smi --> SMI Ergodic Indicator (SMI)
sqz* --> Squeeze (SQZ) * NOTE: code sufferred from very strange error, code was commented.
sqz_pro --> Squeeze PRO(SQZPRO)
xfl --> Condition filter
stc --> Schaff Trend Cycle (STC)
stoch --> Stochastic (STOCH)
stochrsi --> Stochastic RSI (STOCH RSI)
trix --> Trix (TRIX)
tsi --> True Strength Index (TSI)
uo --> Ultimate Oscillator (UO)
willr --> William's Percent R (WILLR)
alma --> Arnaud Legoux Moving Average (ALMA)
xll --> Dynamic rolling lowest values
dema --> Double Exponential Moving Average (DEMA)
ema --> Exponential Moving Average (EMA)
fwma --> Fibonacci's Weighted Moving Average (FWMA)
hilo --> Gann HiLo Activator(HiLo)
hma --> Hull Moving Average (HMA)
hwma --> HWMA (Holt-Winter Moving Average)
ichimoku --> Ichimoku Kinkō Hyō (ichimoku)
jma --> Jurik Moving Average Average (JMA)
kama --> Kaufman's Adaptive Moving Average (KAMA)
linreg --> Linear Regression Moving Average (linreg)
mgcd --> McGinley Dynamic Indicator
rma --> wildeR's Moving Average (RMA)
sinwma --> Sine Weighted Moving Average (SWMA)
ssf --> Ehler's Super Smoother Filter (SSF) © 2013
supertrend --> Supertrend (supertrend)
xsa --> X simple moving average
swma --> Symmetric Weighted Moving Average (SWMA)
t3 --> Tim Tillson's T3 Moving Average (T3)
tema --> Triple Exponential Moving Average (TEMA)
trima --> Triangular Moving Average (TRIMA)
vidya --> Variable Index Dynamic Average (VIDYA)
vwap --> Volume Weighted Average Price (VWAP)
vwma --> Volume Weighted Moving Average (VWMA)
wma --> Weighted Moving Average (WMA)
zlma --> Zero Lag Moving Average (ZLMA)
entropy --> Entropy (ENTP)
kurtosis --> Rolling Kurtosis
skew --> Rolling Skew
xev --> Condition all
zscore --> Rolling Z Score
adx --> Average Directional Movement (ADX)
aroon --> Aroon & Aroon Oscillator (AROON)
chop --> Choppiness Index (CHOP)
xex --> Condition any
cksp --> Chande Kroll Stop (CKSP)
dpo --> Detrend Price Oscillator (DPO)
long_run --> Long Run
psar --> Parabolic Stop and Reverse (psar)
short_run --> Short Run
vhf --> Vertical Horizontal Filter (VHF)
vortex --> Vortex
accbands --> Acceleration Bands (ACCBANDS)
atr --> Average True Range (ATR)
bbands --> Bollinger Bands (BBANDS)
donchian --> Donchian Channels (DC)
kc --> Keltner Channels (KC)
massi --> Mass Index (MASSI)
natr --> Normalized Average True Range (NATR)
pdist --> Price Distance (PDIST)
rvi --> Relative Volatility Index (RVI)
thermo --> Elders Thermometer (THERMO)
ui --> Ulcer Index (UI)
ad --> Accumulation/Distribution (AD)
cmf --> Chaikin Money Flow (CMF)
efi --> Elder's Force Index (EFI)
ecm --> Ease of Movement (EOM)
kvo --> Klinger Volume Oscillator (KVO)
mfi --> Money Flow Index (MFI)
nvi --> Negative Volume Index (NVI)
obv --> On Balance Volume (OBV)
pvi --> Positive Volume Index (PVI)
dvdi --> Dual Volume Divergence Index (DVDI)
xhh --> Dynamic rolling highest values
pvt --> Price-Volume Trend (PVT)
Remarks
I also incorporated func descriptions and func test script in commented mode, you can test the functino with the embedded test script and modify them as you wish.
This is a Level 3 free and open source indicator library.
Feedbacks are appreciated.
This is not the end of pandas_ta lib publication, but it is start point with pine v5 lib function and I will add more and more funcs into this lib for my own indicators.
Function Name List:
bton()
wcp()
count()
xbt()
ebsw()
ao()
apo()
xrf()
bias()
bop()
brar()
cci()
cfo()
cg()
cmo()
coppock()
cti()
dmi()
er()
eri()
fisher()
inertia()
kdj()
kst()
macd()
mom()
pgo()
ppo()
psl()
pvo()
qqe()
roc()
rsi()
rsx()
rvgi()
slope()
smi()
sqz_pro()
xfl()
stc()
stoch()
stochrsi()
trix()
tsi()
uo()
willr()
alma()
wcx()
xll()
dema()
ema()
fwma()
hilo()
hma()
hwma()
ichimoku()
jma()
kama()
linreg()
mgcd()
rma()
sinwma()
ssf()
supertrend()
xsa()
swma()
t3()
tema()
trima()
vidya()
vwap()
vwma()
wma()
zlma()
entropy()
kurtosis()
skew()
xev()
zscore()
adx()
aroon()
chop()
xex()
cksp()
dpo()
long_run()
psar()
short_run()
vhf()
vortex()
accbands()
atr()
bbands()
donchian()
kc()
massi()
natr()
pdist()
rvi()
thermo()
ui()
ad()
cmf()
efi()
ecm()
kvo()
mfi()
nvi()
obv()
pvi()
dvdi()
xhh()
pvt()

1CH1M0KU 8UY 53LL description:
green triangles: baseline up = buy, red triangles : below baseline = down: sell, red arrows: below conversion line =half sell, green arrows: institutional buy = addon ,blue labels: big volume = addon.
This Indicator is based on ichimoku but in modified manner. to understand ichimoku entry exit very easily.
don't have to look & analyze complex ichimoku lines, untick all ichimoku components, only activate shapes to ease out entry exit signal.
use Base Line as Stoploss. This provide nice Risk to Reward ratio more than 1:3.
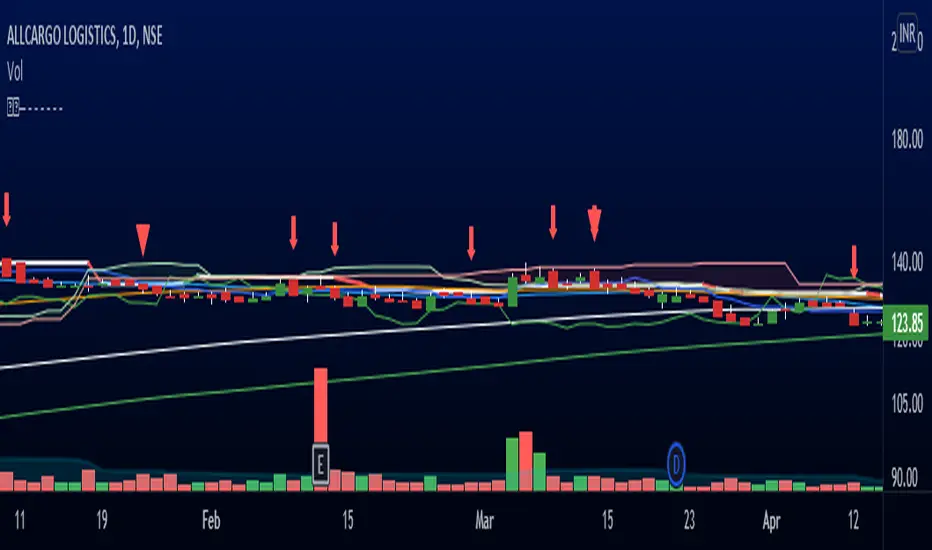
Wyichi AI 4.0Wyckoff logic : " Charles H. Dow and his colleague Edward Jones (Dow Jones & Company since 1882). The Dow Theory's final tenet is, "Trend Remains In Effect Until Clear Reversal Occurs." Dow Theorists look for "failure swings" and confirmations to give unambiguous signals of trend fatigue or trend reversal, according to this concept. Any pattern, whether it's a continuation pattern like a Flag Formation or a reversal pattern like Head & Shoulders , is designed to repeat itself over and over again."
Ichimoku : " An Ichimoku practitioner should be able to get a quick sense of sentiment, momentum, and trend strength by looking at an Ichimoku chart , Hosada was a fervent belief that market dynamics or behavior reflected human group dynamics. He felt that human conduct in their lives and relationships might be defined as a continual cyclical movement away from and back toward balance. "
Wyckoff + Ichimoku = Institutional Footprints ( Trade with the banks)
Indicator use Wyckoff pattern ( APD ) and Ichimoku pattern ( Phase ).... or Bermuda Triangle Pattern