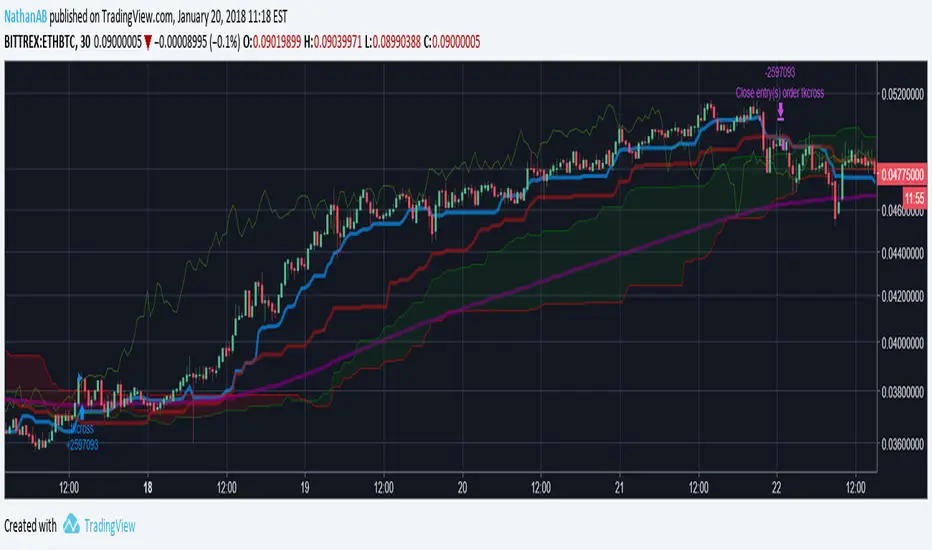
Ichimoku Cloud Strategy for Crypto V2.0Version 2.0
This updated strategy uses additional entry/exit rules based on trend.
This version will only enter short positions if the trend is bearish. While still agressive on bullish signals, it will close long positions earlier if it detects a false bull signal or keep them open should the trend continue to be bullish.
If you prefer a more aggressive strategy check out version 1.0
Do not run this strategy on a timeframe < 1h, best timeframe will be 4h.
Happy Trading!!
If you find this strategy useful, please consider a donation to:
BTC: 1PGuWcQwb4WZyFYX4ehyqcJWcbX42jW7Y6
ETH: 0x912aD30Ff9A49c69D51ECeE5A65A7E7d5321ED0C
Cerca negli script per "ichimoku"

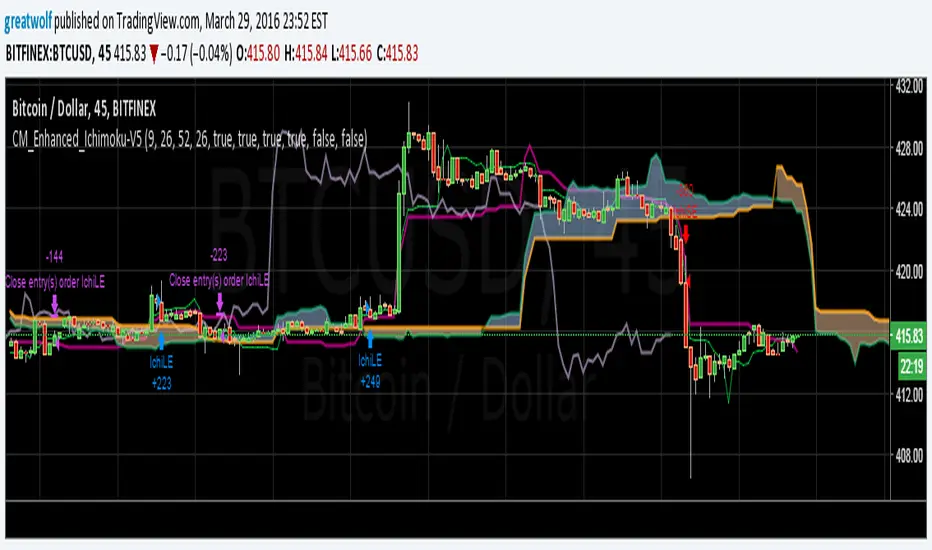
Ichimoku Cloud Strategy for CryptoVersion 1.0
This strategy uses the Ichimoku Cloud indicators and is based on a bot i developed. The bot has more entry/exit rules which will hopefully be added in the near future.
Still a profitable strategy even in it's simplest form.
Do not run this strategy on a timeframe < 1h, best timeframe will be 4h
Happy Trading!!
If you find this strategy useful, please consider a donation to:
BTC: 1PGuWcQwb4WZyFYX4ehyqcJWcbX42jW7Y6
ETH: 0x912aD30Ff9A49c69D51ECeE5A65A7E7d5321ED0C

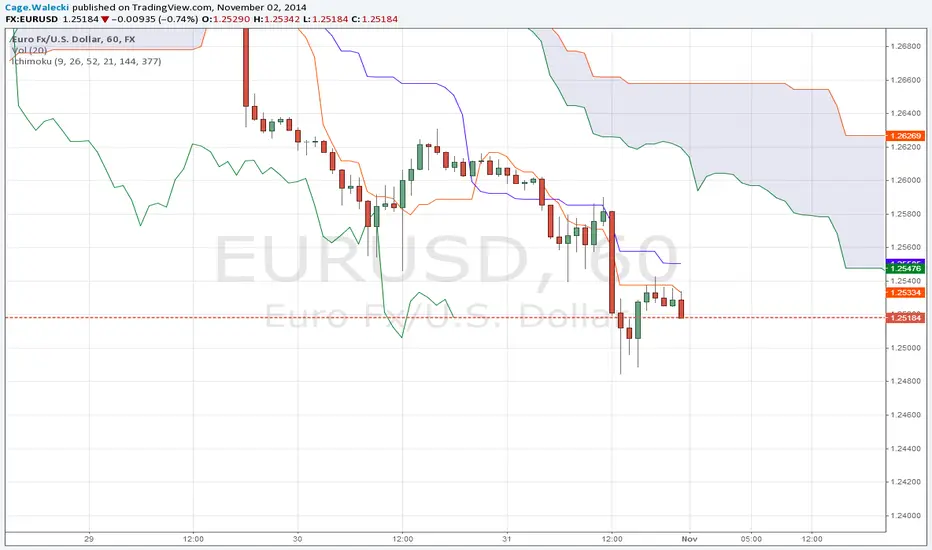
Ichimoku Cloud strategy for gold marketThis strategy is based on main ichimoku features (Leading span , conversion line and base line) compared to cloud conditions.
I indicated all possibilities in this indicator and strategy decision is based on crossing factors of each main line through two other line confirmations.


Ichimoku Cloud Trading StrategyThis is an Ichimoku Cloud trading strategy that executes trades based on strong signals. In place of the kumo, I used the 100-period EMA .

Ichimoku Kumo Twist Strategy with Presets [Krypt]A simple strategy for testing Ichimoku settings used in the following indicator:

Ichimoku TK Cross > EMA200 Crypto StrategyIchimoku strategy for cryptocurrency trading.
Enters trades on bullish tenkan-kijun crosses when price is above 200 EMA which suggests a long-running bullish trend.
Ichimoku Cloud w/SelIchimoku Cloud with selection for:
Regular:
conversionPeriods = 9,
basePeriods = 26
laggingSpan2Periods = 52,
displacement = 26
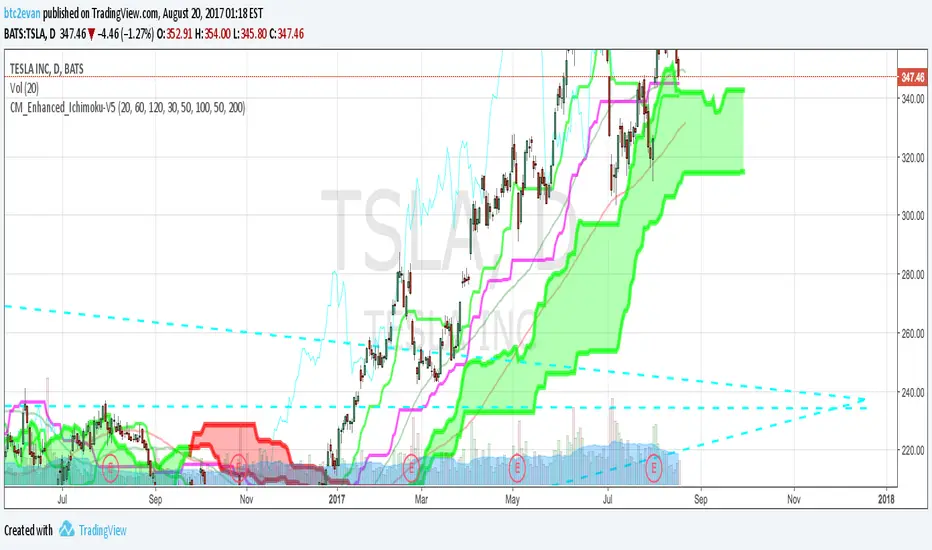
Crypto:
conversionPeriods = 10,
basePeriods = 30,
laggingSpan2Periods = 60,
displacement = 30
Crypto Doubled:
conversionPeriods = 20,
basePeriods = 60,
laggingSpan2Periods = 120,
displacement = 30


Ichimoku EMA BandsSome find Ichimoku Clouds bit complicated. This simplified version is combined with EMA Bands may be profitable. Give a try!. I recommend hourly timeframe for good results. Aye! :D

Ichimoku-Hausky Trading systemThis is a indicator with some parts of the ichimoku and EMA. It's my first script so i have used other peoples script (Chris Moody and DavidR) as reference cause I really have no idea myself on how to script with pinescript.
Hope that is okay!
I use 20M timeframe but it should work with any timeframe! I have not tested this system much so I would really appreciate feedback and tips for better entries, settings etc..
Tenken-sen: green line
Kijun-sen: blue line
EMA: Purple
Rules:
Buy:
IF price crosses or bounce above Kijun-sen
THEN see if market has closed above EMA
IF Market has closed above EMA
THEN see if EMA is above Kijun-sen
IF EMA is above Kijun-sen
THEN buy and set trailing stop 5 pips below EMA
Sell:
IF price crosses or bounce below Kijun-sen
THEN see if market has closed below EMA
IF Market has closed below EMA
THEN see if EMA is below Kijun-sen
IF EMA is below Kijun-sen
THEN sell and set trailing stop 5 pips above EMA

Ichimoku Cloud ALERTHi, this my new script which show you correct Ichimoku signals, when price exit cloud.
SELL SIGNAL:
- red line below blue
- green line below price
- price exit cloud bottom
- price below 3 EMA's!
BUY SIGNAL:
- red line above blue
- green line above price
- price exit cloud upper
- price above 3 EMA's!
You can change ichimoku parameters and input 3 EMA's. If u dont want use any of the EMA's then input 1 into them.
KumoTrade Ichimoku StrategyThe KumoTrade Ichimoku Strategy is an advanced trading strategy designed to help users identify market trends and potential trading opportunities using the Ichimoku Kinko Hyo technical analysis indicator. This strategy leverages the Ichimoku cloud (Kumo) along with other crucial indicators such as the Tenkan-sen and Kijun-sen lines to generate strong signals.
Main Components of the Strategy:
Tenkan-sen (Conversion Line): Indicates the short-term direction of the price, typically calculated as the average of the highest high and the lowest low over the past 9 periods.
Kijun-sen (Base Line): Indicates the medium-term direction of the price, usually calculated as the average of the highest high and the lowest low over the past 26 periods.
Senkou Span A and Senkou Span B: These two lines form the cloud (Kumo), which projects future support and resistance levels.
Chikou Span (Lagging Span): Plots the current closing price 26 periods back to measure the market's momentum.
Strategy Rules:
Bullish Bias (Bias Bull): Indicates that the prices are in a long-term uptrend. In this strategy, this is confirmed if the low prices are above the daily EMA (Exponential Moving Average).
Kijun Sen Touch Down: Occurs when prices cross below the Kijun-sen line and then close back above it, indicating a potential bullish reversal.
Tenkan-Kijun Cross Up: A bullish signal generated when the Tenkan-sen line crosses above the Kijun-sen line.
Close Over Tenkan and Kijun: A strong bullish signal when the close price crosses above both the Tenkan-sen and Kijun-sen lines.
Trading Setups:
Long Setup: Generated when the Kijun-sen is above the highest point of the Kumo (senkou_max) and the closing price is below the lowest point of the Kumo (senkou_min). This setup is checked over the last 21 bars.
Short Setup: Generated when the Kijun-sen is below the lowest point of the Kumo (senkou_min) and the closing price is above the highest point of the Kumo (senkou_max). This setup is also checked over the last 21 bars. (Not avalible yet)
Entry Conditions:
Ultra Long Entry: This condition checks for a bullish bias, the Tenkan-Kijun cross up or Kijun Sen touch down, high volume, and that the price is not within the Kumo cloud.
Main Long Entry: This condition requires the closing price to be above the Kumo cloud, a green Kumo cloud, a bullish bias, the Tenkan rule, and that the price is not within the Kumo cloud.
Exit Conditions:
A trailing stop loss is implemented to protect profits. The stop loss level is dynamically updated based on the highest high of the last 5 bars minus three times the ATR (Average True Range) value.
Visuals on the Chart:
The Tenkan-sen and Kijun-sen lines are plotted for visual reference.
The Kumo cloud is displayed with different colors indicating bullish (green) or bearish (red) conditions.
Entry points are marked on the chart, and the trailing stop loss levels are plotted as well.
The KumoTrade Ichimoku Strategy aims to provide a comprehensive approach to trading by combining multiple aspects of the Ichimoku indicator to generate reliable trading signals and manage risk effectively.

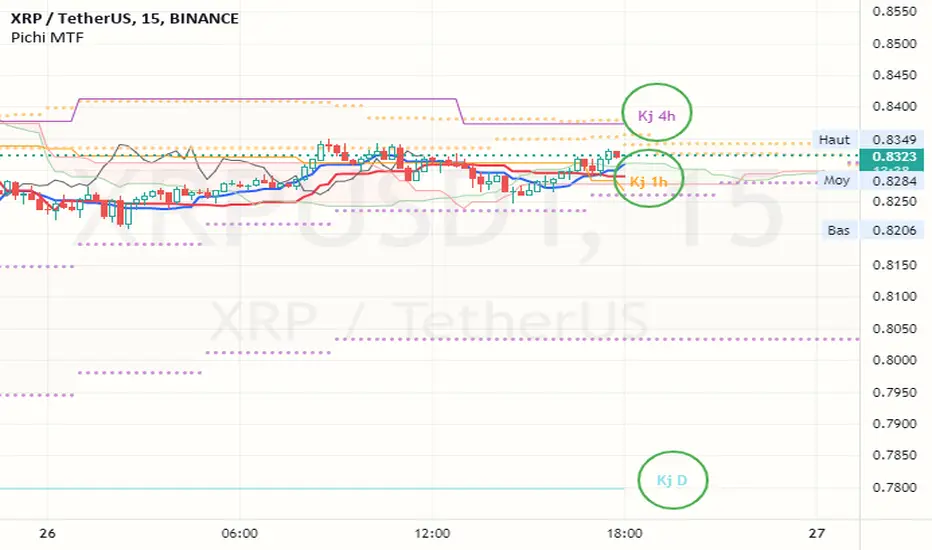
Pax24 MTF IchimokuPax24 Multiple Time Frames and Adaptative Ichimoku Cloud.
(based on the scripts : MTF Selection Framework by PineCoders and MTF ichimoku by anthonyf50)
Possible display :
- four differents Ichimoku, 1 current and 3 from higher UT (depending on your actual UT)
- Tenkan, Kijun, Chikou and Kumo for all
- labels : offset from line, color if you change style and with/without abbreviation
The 3 upper ichimoku you can display depends of your actual Time Frame :
- M1, M3 => M5 M15 H1
- M5 => M15 H1 H4
- M15, M30, M45 => H1 H4 D
- H1, H2, H3 => H4 D W
- H4, H6, H12 => D W M
- D => W M
- W => M
- M => none other
To add the indicator on your graph, go to "Indicators" then search for "Pax24 MTF Ichimoku" and add the script to your favorites.
-------- CONFIGURATION -------
Base : ichimoku numbers
ichimoku and +1 +2 +3 : Show the first ichimoku (actual UT) and 3 others (higher UT)
for each :
Tenkan : Show the Tenkan
Kijun : Show the Kijun
Chikou : Show the Chikou (Lagging span)
Kumo : Show the Kumo
Label : Show the labels
Offset : Label offset
Color : Label color (because you can't change the style of the label in "Style")
Abbreviation : Label abbreviation (Tk = Tenkan)
If you want to best see others UT kumo, change transparency in style for Kumo
There may be slow display since TradingView requires a minimum of candles to make these calculations. Just zoom out and then zoom in to fix the problem (especially for kumo).
Double Ichimoku on different timeframeThis script is just Ichimoku but 2 times :
- default one on current timeframe
- second one that you can add (totally or partially) to have by example Ichimoku weekly when you are on 4h chart
For the second Ichimoku, the cloud is projected exactly 26 periods front as if you was on the second timeframe (not the current one), so you have to tell to the script if you are on 7/7 market (like crypto) or 5/7 market (like forex, indice, etc.). This point is important because even if you are on smaller timeframe you need to have the 2nd cloud well placed.
== FR ==
Ce script est simplement Ichimoku mais 2 fois :
- par défaut, un Ichimoku sur la période en cours
- un second que vous pouvez ajouter (totalement ou partiellement comme seulement SSB ou tenkan) pour avoir par exemple Ichimoku hebdomadaire quand vous êtes sur le graphique en 4h
Pour le second Ichimoku, le nuage est projeté exactement 26 périodes en avant comme si vous étiez sur la seconde période (pas la période actuelle), donc vous devez dire au script si vous êtes sur le marché 7/7 (comme crypto) ou 5/7 (comme forex, indice, etc.). Ce point est important parce que même si vous êtes sur une période plus courte, vous avez besoin d'avoir le 2e nuage bien placé.

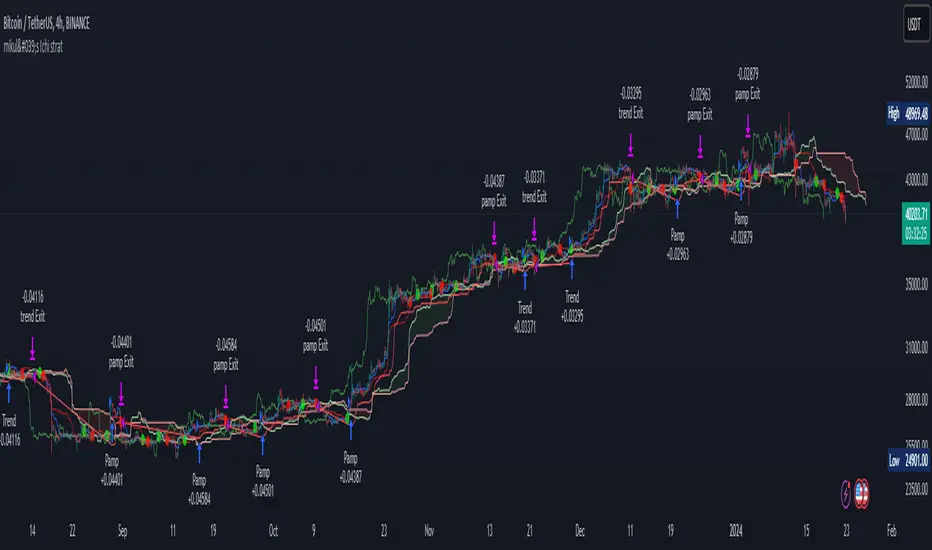
mikul's Ichimoku Cloud Strategy v 2.0This is an Ichimoku cloud (long) strategy with both pump signals and trend signals.
It has both ATR stop loss, trailing percentage stop loss and also ichomoku cloud exit signal.
You can also combine the ATR stop loss and the trailing percentage stop loss with the Ichimoku cloud exit signal and a the take profit percentage.
In this example I use the default ATR stop loss method for taking profit.
10000$ is my initial capital and I risking 10% every trade. Commission is set to 0.075%.
Everything is set to default in this example.
There is also a moving average filter that is available, set to 200 EMA and turned off by default.
Conditions for taking a long position:
Trend Signal:
• Positive cross above the cloud
• Chikou span(lagging span) above price action
• Price above the Cloud
Pump Signal:
• Cloud ahead of you is green
• Price above the cloud
• Positive cross (Doesn’t Matter Where)
• Chikou span(lagging span) above the cloud
Ichimoku cloud exit signals:
• Negative cross
• Chikou span(lagging span) touches the price action
This strategy is totally free as freedom and as in free beer!
I do this for myself, but I like sharing and I want everyone to have the ability to use what I make no matter your economic situation.
If you have any suggestions for this strategy or perhaps any filtering options that could be fun to experiment with, then please leave a comment with your suggestion and maybe I can add it to the next version.
[Kai]Ichimoku 一目均衡表LOG Computable Ichimoku clouds Ichimoku Kinko Hyo
Expected to be used on LOG scale
Please note that the value is calculated slightly smaller because it is calculated in LOG.
The usage seems to be the same as the normal Ichimoku clouds Ichimoku Kinko Hyo
* By default, LOG MODE is setting so if you need normal display, set it to FALSE.
LOG計算可能な]Ichimok clouds 一目均衡表です
LOGスケールでの使用を想定しています
LOG計算しているので値は若干小さめに算出されるので注意が必要です
使用方法は通常のIchimok clouds 一目均衡表と同じで良いと思われます
※デフォルトではLOG MODE設定になっていますので、通常の表示が必要な場合は設定でFALSEにしてください

[OZ]MTF Ichimoku CloudBased on this script from RicardoSantos:
This script can display Ichimoku cloud , SSA , SSB , Chikou, Kijun and Tenkan from another time frame.
With it you can apply Karen Péloille's MTF Ichimoku Kinko Hyo advanced trading techniques on TradingView.
By default Tenkan is not displayed (fully transparent).
The original script has been enhanced to draw the full cloud beyond the price and to draw the Chikou.

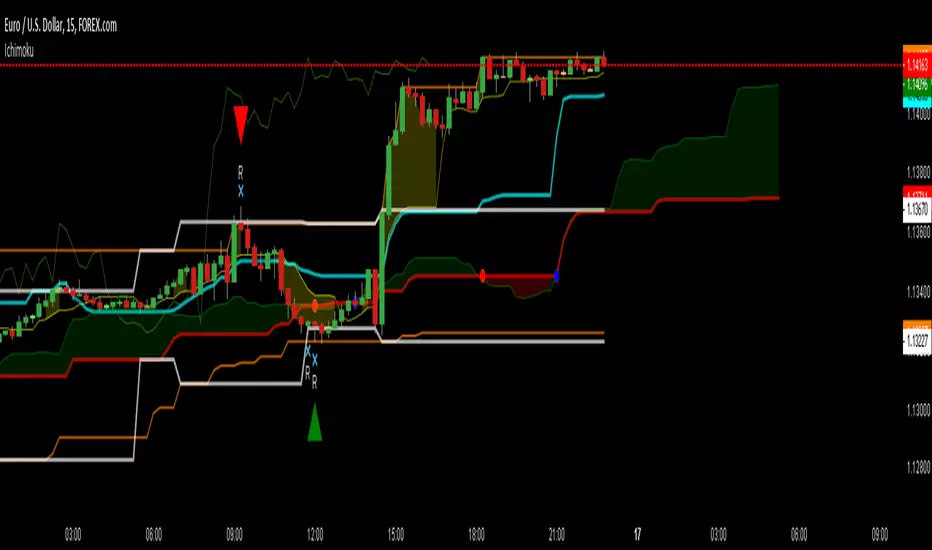
JPCOQ Ichimoku V2INDICATORS:
Show Yellow zone between price and tenkan when oversold/overbought
Show splits : white when to come, yellow when occurs, red when occurs with a flat Senkou Span B, blue when occurs with a flat Senkou Span B and kijun
Show probable range in white lines
Show last higher highs & lower lows in orange lines
SIGNALS (when ichimoku meet candle patterns)
L/H = rebound signals on higher highs / Lower Lows, target can be lower kj flat
C = potential rebound on overbought oversold zone, target can be lower kj flat
R = rebound signal on range edges, target can be last split
B = pullback/throwback rebound after break out of probable range, target can be last higher high (lower low)
K = rebound on Kj in a trend (out of range), target can be last higher high (lower low)
OTHER PARAMETERS
checkHaram = take Harami pattern into account
CheckallCandle = include all candle patterns
checkVol = show "V" when volume is higher than last 9 periods average
showFuture = next kijun/ssa/ssb values in thin lines
closeToChikou = the greater the value close to ichimoku lines is the test
showChikou = red cross on price when close to chikou in TF or upper one
Flatlen = bars of same value to validate an ichimoku flat
CheckSignal1 = check and show upper TF signals => manual check because not perfect, to unset when study error message !!
ShowEntry = green buy signal (red sell) when buy signal and chikou free and ratio >=2
Dual Ichimoku CloudDual timeframe Ichimoku cloud (1x - Lower Timeframe & 5x - Higher timeframe). Higher timeframe trend can be identified in the same chart.

Improved Ichimoku Cloud: smoother and easier backtesting1. Smoother
This indicator uses the moving average of the price to calculate the Ichimoku cloud. The result is a smoother indicator that filters out noise. Bear in mind, it's a bit slower as well. Change the MA Len setting to 1 in order to display the traditional Ichimoku cloud.
2. Easier backtesting
When you're using the indicator in live trades, you're used to seeing the lagging span displaced back in time (hence the name). The lagging span gives information about if it is or isn't in the price range of a certain amount of candles ago. But when you're back testing, it's hard to find the exact point on the lagging span that matches the price in the past. You have to calculate what time it was, accourding to 'lagging span periods' ago, relative to the candle you want to observe in your back test. Then you have to find that moment on the timeline by eye. Therefore I made the Visual Method adjustable.
If you set the Visual Method to 'back test', the lagging span moves forward in time instead of backward. This swaps the idea: instead of inspecting whether the lagging span was in the price range, you can inspect if the price was in the lagging span range (or forward span, if you like). Seems weird, but the result is the same.
3. Mind the crypto default settings!
I have developed the indicator for crypto currency so the default settings are 20, 60, 120, 30. When you're not trading crypto's, set it to 9, 26, 52, 26. You can always use your own favorite settings, regardless what you're trading.
