Cerca negli script per "ichimoku"

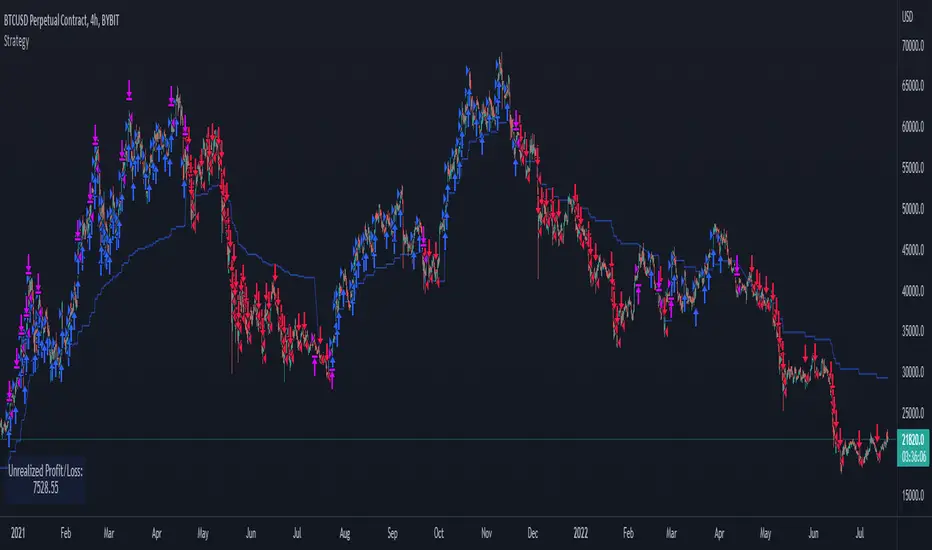
Support and Resistance RoboTBINANCE:ETHUSDT
Algorithmic Trader
Coded by Pinescript V5
Best strategy you can find in trading cryptocurrencies
With the ability to adjust settings
Profitable each year
This strategy uses supports and resistances combined with ichimoku
This automated strategy trades on ETH/USD
(ranks second in cryptocurrency marketcap).
We have had real trade results for more than 10
months and backtesting for more than 8 years.
The results are for mid-risk
settings. If the settings are changed, you can
potentially achieve more profit or a lower
drawdown.
Default settings : EMA,EMA,14,1.5,1.5,23,0.5,31,10,W
“An investment in knowledge pays the best interest”
Benjamin Franklin
If you're interested, we can
provide you with access to
examine the strategy.
Thanks!

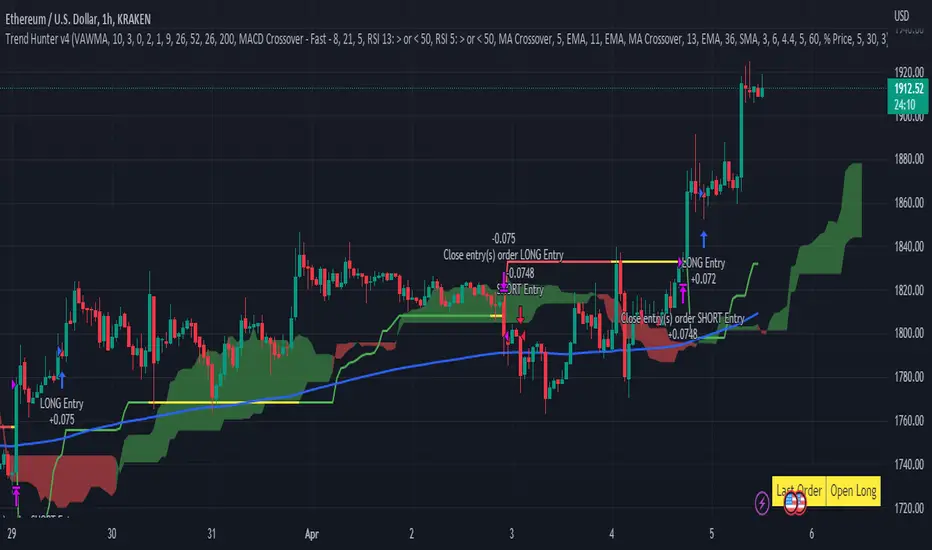
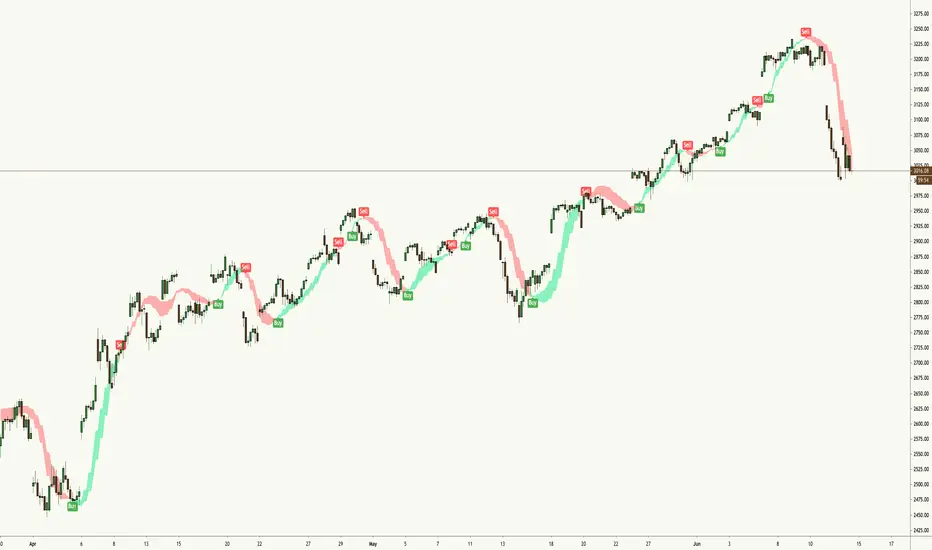
Trend Hunter v4This strategy follows the Trend Hunter training strategy taught at InvestIshare.
Entries are made based predominantly on the price action being above/below the Ichimoku Cloud with the ATR based super trend being used as a trailing stop loss.
Additional trend tracking tools can be toggled on / off to improve the wind rate on some time frames, with additional options available to limit entries if certain conditions are met.
If you would like access to this indicator, send me a DM on the Investishare Discord in the Trend Hunters channel.
The default parameters are set for BTC on the 2 HR time frame
Scalping Alice 3/5INTRO
Scalping Alice is a work in progress. I made it to help with my Scalping Long strategy as a helper for entrances.
This instance of the indicator is for 3min and 5min chart analysis only.
It still needs to further adopt and calibrate multi-frame data, but for the moment it takes from the Daily, the Hourly and the 15min.
It is meant to be used WITHOUT candles. This is because, one of the goals I'm trying to achieve is to compress data and leave out unwanted noise.
The 3min and 5min candles are very dynamic (specially in the crypto market), so I don't need to know the whole OHLC, but I do need a range.
COMPONENTS
Small Blob
The first component is the current time-frame Price Blob. The top line is the candle Highs and the bottom line is the candle Lows.
The Price Blob's Color changes according to a Double RSI which you can modify the values for.
The default is 13 for the Fast RSI and 34 for the Slow RSI.
When the Fast RSI is on top it turns Green. When the Slow RSI is on top it turns Red.
Big Blob
The Outer Blob is the same as the inner blob, but in the 15min time-frame. It changes color the exact same way, but with 15min values.
WMA Line
The closest line to the blob is the WMA line. You can change the default value, which is 21.
The color changes according to a complex modifier, that I will try to explain, but most likely fail.
It takes a sort of Tenkan (see Ichimoku Cloud if you don't know what a Tenkan is) value from the 15min chart and the Hourly chart.
It then compares the difference from these Tenkans and adds it to the 15min mid price.
And finally tries to find a fast Trend of the movement of the price for the last 3 candles.
The Tenkan value can be changed from it's default 3. Be wary, this changes the Tenkans for all the timeframes.
Blue Tenkan
The slower line is an Hourly Tenkan but with a value of 9.
Saturation Clouds
The last piece are the orange Saturation Clouds. These appear in bigger price movements and work weirdly.
They are differences between Hourly Tenkan and current frame Tenkan, along added to the mid point of the price and a little bit of Bollinger math.
Again, hard to explain, but they are very useful. Maybe one of the most useful parts of Alice.
BULL AND BEAR
Bullish :
- Green Small Blob
- Green Big Blob
- Green WMA
- Small Price Blob Above WMA
- Small Price Blob Above Blue Tenkan
- Small Price Blob Inside Upper Saturation Cloud
- Lower Saturation Cloud appears but DOES NOT touch Small Price Blob
Bearish
- Red Small Blob
- Red Big Blob
- Red WMA
- Small Price Blob Below WMA
- Small Price Blob Below Blue Tenkan
- Small Price Blob Inside Lower Saturation Cloud
- Upper Saturation Cloud appears but DOES NOT touch Small Price Blob
SMALL TIPS
Saturation Clouds
When the Saturation Clouds appear, it is an indication of strong price decision.
If it appears but it is far from the Small Blob then this indicates Price Reversal.
Most likely a nice moment to enter an opposite trend trade.
If the cloud appears touching the Small Blob and the Small Blob enters the cloud, this is Trend Confirmation.
The price is going to go strongly towards the Trend is is on.
Most likely a nice moment to enter an accompanying trend trade.
Price Bounce
The Small Blob bounces inside the Big Blob. This is very useful for numerous short plays.
You have better chances opening longs when the price is on the Lower parts of the Blobs.
The same goes for shorts on the Upper Parts.
Slow and Fast
The color of the WMA is a very fast indicator, it's the least reliable one.
Then comes the Small Blob color, then comes the WMA itself.
Following that you have the Big Blob color, then the blue Tenkan.
And finally the Saturation Clouds are the most reliable part.
FINAL THOUGHTS
This is a publishable version of this strategy. I hope to keep working on these types of strategies, maybe even upgrading this one.
Enjoy, share and leave comments!

Double Ichimoku Cloud with drop-down selectable lookback periodsThis script will display two Kumo Clouds. The overlap between the clouds can be areas of high support or resistance. I've included a drop-down selector for a variety of common lookback periods. Experiments show that the 10-30-60-30 settings can be more applicable to the FOREX and Crypto markets.
T/K CROSSSimple crossing of the Tenkan & Kijun Sen indicated by a "Cross". Surfed Tradingview for it, but did not find it, so decided to make one. Does NOT include the Ichimoku Cloud & the Chikou

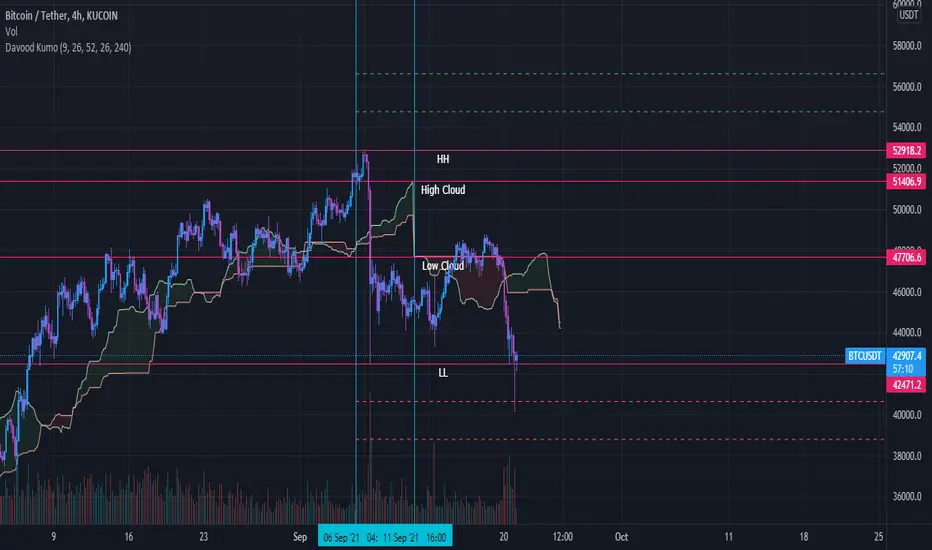
Davood Kumothis andicator is build in base of ichimoku cloud.
Select the interval at which the kumo clouds change phase and depending on what time frame we are in, we give the time inputs to the indicator.
then, the indicator calculates the area of the cloud and set the ascending and descending targets when price break the highest or lowest candle in that time range.
So entry point is the highest and lowest candle and first and second targets are determined by the indicator.
note : i used this andicator only in crypto market not forex and it works well
Specific Date Series (llnylk's)Show specific dates/bars (useful for Ichimoku cloud)
Show where are -9th bar, -20th bar, -26th bar, -52th bars in the past

FTRS PROThe script works differently on different time frame. Works best in 1 min time frame. The script take advantage on ichimoku cloud for trend analysis, RSI for 2nd trend identification and a custom command to identify point of entry for the market bias. This is NOT a counter trend strategy, it is purely to capture the market bias on the chart. User able to customize based on their preferences risk to reward ratio and play along with user's own risk appetite.

Sola Fide [Strategy]Sola Fide High Accuracy with ATR R:R
Indicators used:
- Stochastic RSI
- Chopiness Index
- RSI
- Ichimoku Cloud
- ATR
Script has been set up in strategy format to give backtesting data.
The strategy has been made for BTC and ETH pairs against USDT on the hourly timerframe
Currently outperforming the Buy and Hold Return on both assets.
This script has been made to make it easier to automate strategies on 3commas
In the settings you will see options for BTC strategy or ETH strategy
Choose the asset you are on, copy your 3commas Bot ID and Email token and paste them into the settings box for eachever asset you are on.
To receive the alerts set up within the strategy, in your alert message box use " {{strategy.order.alert_message}}"
This will then be able to send any orders taken on the tradingview script directly to your long or short bot on 3commas
This strategy is set up with a strict set of rules on the ATR for the Take profits and Losses.
There is a repaint warning because the code uses heikin ashi candles through the security function, the given entry and exit signals do not repaint,
I have been automating this for myself with no errors.
You don't need to use more than 3x leverage...
Past results do not guarentee future results.

BT CloudBT Cloud is a trading system with an advanced chart overlay showing a very reliable Trend Indicator based off Price, Trend, Momentum, and Market Structure.
Inspired by the Ichimoku Cloud, Parabolic SAR, and Exponential Moving Averages the BT Cloud removes the unnecessary fluff and focuses on the Golden Zone 0.618 to 0.50 Levels on the current time frame for typical RSI length (14) settings.
User should pay attention to where the cloud reverses directions. These areas are 50% ranges of significance and have a high chance of acting like target zones for support and resistance in the future.
This indicator will allow the user to make observations around how extended the trends against each other as well as serving as basis for divergence and trendline studies drawn in manually by the user. The oscillator will turn green/red as observable on the main chart overlay.

BTC_ISHIMOKUInvestment trading strategy on the daily timeframe of the BTC-USD pair based on the Ichimoku cloud indicator

Hosoda Cycles (24x7 mkt) {fmz}This script allows you to see on the chart which are the bars, including future ones, which correspond to the cycles of Goichi Hosoda, the inventor of Ichimoku Kinko Hyo.
This script is only suitable for 24x7 markets, it is not suitable for markets with closing times and weekends, or gap markets where trading is not active. In fact, the calculation of calendar times is used, not suitable for markets with closing times.
Use the settings to indicate what the start time of bar 1. The indicator will produce many vertical bars, even in addition to the end time of the graph.

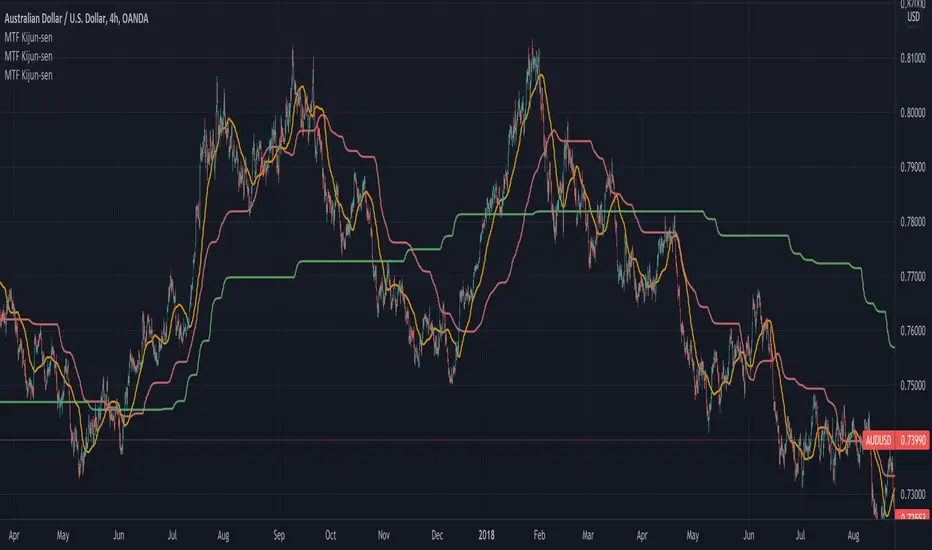
Multi Timeframe Kijun-sen [Takazudo]Multi Timeframe Kijun-sen implementation. Kijun-sen is a part of Ichimoku Kinko-hyo. This study is intented to be used as a part of buy/sell strategies.
This may be useful for lower timeframe entries.
This Kijun-sen script can be smooth using MA.
Backtst CloudHappy Holidays here is a gift!
This a cleaned up Ichimoku cloud with RSI coloring.
Can be used to remove some of the the noise.
How to read chart:
Cloud support and resistance zones.
A green line is RSI > 50
A red line is RSI <= 50

Easy System 420In this strategy, 15 indicators are used, each giving its results as a numerical value, which then is added or subtracted from the total points, gathered from all 15 indicators.
Many thanks to RafaelZioni for his great work making the EasySys1 script which i modified to create this script.
Onchart is drawn some of the indicators, but not all, a info panel is drawn showing the value each indicator has calculated. The info panel can be turned on or off.
Many of the indicator settings can be changed by user, and this is recommended, to tune the strategy to users chosen pair/timeframe.
Therefore any pair or timeframe can be used, the strategy tester results showing possible results, remember to set commission to match your broker. example chart settings here have common crypto exchange commission value: 0.25%
indicator list : SAR + STT + ZigZag + ROC + DMI + CCI + Weis + SMA + AO + MOM + Hist + BB + Ichimoku + HMA

Dynamic Dots Dashboard (a Cloud/ZLEMA Composite)The purpose of this indicator is to provide an easy-to-read binary dashboard of where the current price is relative to key dynamic supports and resistances. The concept is simple, if a dynamic s/r is currently acting as a resistance, the indicator plots a dot above the histogram in the red box. If a dynamic s/r is acting as support, a dot is plotted in the green box below.
There are some additional features, but the dot graphs are king.
_______________________________________________________________________________________________________________
KEY:
_______________________________________________________________________________________________________________
Currently the dynamic s/r's being used in the dot plots are:
Ichimoku Cloud:
Tenkan (blue)
Kijun (pink)
Senkou A (red)
Senkou B (green)
ZLEMA (Zero Lag Exponential Moving Average)
99 ZLEMA (lavender)
200 ZLEMA (salmon)
You'll see a dashed line through the middle of the resistances section (red) and supports section (green). Cloud indicators are plotted above the dashed line, and ZLEMA's are below.
_______________________________________________________________________________________________________________
How it Works - Visual
_______________________________________________________________________________________________________________
As stated in the intro - if a dynamic s/r is currently above the current price and acting as a resistance, the indicator plots a dot above the histogram in the red box. If a dynamic s/r is acting as support, a dot is plotted in the green box below. Additionally, there is an optional histogram (default is on) that will further visualize this relationship. The histogram is a simple summation of the resistances above and the supports below.
Here's a visual to assist with what that means. This chart includes all of those dynamic s/r's in the dynamic dot dashboard (the on-chart parts are individually added, not part of this tool).
You can see that as a dynamic support is lost, the corresponding dot is moved from the supports section at the bottom (green), to the resistances section at the top (red). The opposite being true as resistances are being overtaken (broken resistances are moved to the support section (red)). You can see that the raw chart is just... a mess. Which kinda of accentuates one of the key goals of this indicator: to get all that dynamic support info without a mess of a chart like that.
_______________________________________________________________________________________________________________
How To Use It
_______________________________________________________________________________________________________________
There are a lot of ways to use this information, but the most notable of which is to detect shifts in the market cycle.
For this example, take a look at the dynamic s/r dots in the resistances category (red background). You can see clearly that there are distinctive blocks of high density dots that have clear beginnings and ends. When we transition from a high density of dots to none in resistances, that means we are flipping them as support and entering a bull cycle. On the other hand, when we go from low density of dots as resistances to high density, we're pivoting to a bear cycle. Easy as that, you can quickly detect when market cycles are beginning or ending.
Alternatively, you can add your preferred linear SR's, fibs, etc. to the chart and quickly glance at the dashboard to gauge how dynamic SR's may be contributing to the risk of your trade.
_______________________________________________________________________________________________________________
Who It's For
_______________________________________________________________________________________________________________
New traders: by looking at dot density alone, you can use Dot Dynamics to spot transitionary phases in market cycles.
Experienced traders: keep your charts clean and the information easy to digest.
Developers: I created this originally as a starting point for more complex algos I'm working on. One algo is reading this dot dashboard and taking a position size relative to the s/r's above and below. Another cloud algo is using the results as inputs to spot good setups.
Colored Bars
There is an option (off by default, shown in the headline image above) to fill the bar colors based on how many dynamic s/r's are above or below the current price. This can make things easier for some users, confusing for others. I defaulted them to off as I don't want colors to confuse the primary value proposition of the indicators, which is the dot heat map. You can turn on colored bars in the settings.
One thing to note with the colored bars: they plot the color purely by the dot densities. Random spikes in the gradient colors (i.e. red to lime or green) can be a useful thing to notice, as they commonly occur at places where the price is bouncing between dynamic s/r's and can indicate a paradigm shift in the market cycle.
_______________________________________________________________________________________________________________
Timeframes and Assets
_______________________________________________________________________________________________________________
This can be used effectively on all assets (stocks, crypto, forex, etc) and all time frames. As always with any indicator, the higher TF's are generally respected more than lower TF's.
Thanks for checking it out! I've been trading crypto for years and am just now beginning to publish my ideas, secret-sauce scripts and handy tools (like this one). If you enjoyed this indicator and would like to see more, a like and a follow is greatly appreciated 😁.

CC - PVT CloudsReleasing this test script for PVT ratios using sub-interval harmonics at a 1D, 4H, 1H, 45M, 15M and 5M level.
It basically takes the PVT values for a rolling periodic interval and gets the (avg - min)/max for that interval (the ratio).
Then it colors it based on the subinterval next to it. Just think of it as rolling Ichimoku clouds, but in real-time using PVT.
I'm not saying much more than that, as this is an experimental indicator. Feel free to use it and give me feedback.
Drop a like if this helps you trade, but please do not use these indicators as a DIVINING ROD for your trades.
However, I will possibly release a paid version with TEXTUAL take profit/stoploss indicators.
*DISCLAIMER*
No amount of technical indicators will safe you from a lapse in Due Diligence or Market/Industry Judgement.
I am not responsible for lost equity due to trades caused my relying on this indicator.

The Strategy - Ichimoku Kinko Hyo and moreThe purpose of this strategy is to make the signals from my scripts available for verification by backtests. Different signal and filter combinations can be created and specific manual parameter optimization can be carried out.
In detail, this strategy includes:
23 entry signals
two entry filters with each 9 filters
two exit filters with each 9 filters
take profit and stop loss
time period for backtesting
InariN simpleJapanese legendary day trader's indicator "InariN" .
"N jijii " introduced this original indicator at his ebook and I made it simple for my own use .
This is not original type but I picked up essential elements to practice his idea .
I guess he is real forex day trader and "InariN" is similar to "Ichimoku" .
I have used this at EUR/USD 5 minutes chart for several months and I get basis for judgement .
This is not a magical tool but you can make good reference point to use this .
I think " I " means first swing , " nari " is " become " and " = " , and " N " is third swing .
For example , look at chart , AB is first swing ,BC is second and CD is third .
In many cases ,AB = CD and it called measured move .
"InariN" provide reference point to decide always-in ,entry point , entry timing and exit point.
1.
"InariN" is a trendfollowing tool , you can judge bull or bear by a few lines .
25 ema represent short time frame , 49 (about 4 hour bar at 5 minutes chart ) is middle time frame and 217 (about 18 hour at 5 minutes chart )is long time frame (preset periods is "N jijii" style . please use favorite time frame ).
For example , when current price is above 25ema ,49ema and 217 High-low band"s middle line , market is strong bull .
So you can do multi time frame analyze .
Hint ; you also have to check daily chart's trend .
2.
Every line provided by "InariN" tends to become bull-bear battle point , so you can easily check where is support and resistance line .
Hint ; Especially 25ema is important to pullback entry in trend and 217 high-low line is important to do fade trade in range and reversal .
You have to wait entry until touch and stick lines and follow winner (to avoid failed breakout check shrinking bar) .
3.
You can also use lines to except exit point because high-low band is symmetry .
Hint ; I recommend use custom fibonacci retracement tool to measure Risk-Reward Ratio and exit point .
I customized fibo tool to be symmetry .
Entry point ,exit point and loss cut point became symmetry and you can add other symmetry points more .
For example , look at chart , blue lines is fibo tool and you can measure exit point .
Have fun!!

Easy Loot Money MakerEasy Loot Money Maker Script
This indicator uses modified Bollinger Bands & Ichimoku Clouds to generate the best opportunities to buy & sell
Works best on lower timeframes, so if you're a day trader or scalper, this indicator is for you
I recommend using anywhere from 5 minute, 15 minute, 1 hour, to 2 hour timeframe to give you the best opportunities on entry & exit price
Obviously mix in your own technical analysis such as support, resistance, and trendlines in addition to using this indicator to make a decision on whether to buy or sell.
This chart here looking at the 1H chart of S&P500 (SPX), you can clearly see that the indicator called the top as well as these miniature swing highs and lows.
To add this indicator to your chart, simply press the 'like' button and it will be added to your favorites under the 'Indicators' tab at the top of your chart.
Please let me know if you have any questions or concerns regarding this indicator, as well as feedback on using it whilst trading.
BERLIN CandlesA problem with Heikin Ashi is that while it gives you a great overview of overall direction, it is rarely possible to use it as a replacement for normal japanese
candlesticks. The reason for this is that actual price data is lost, since the candles are more akin to a moving average than a different way to see price action. Also, with Heikin Ashi, most of the actual price action is lost, because the candles can be bigger than the high and low of the underlying japanese candlestick.
With BERLIN Candles I have tried to fix that problem. By using a smoothed out version of the previous Heikin Ashi candle close as the current BERLIN Candle open, the high and low of the actual japanese candlestick for the high and low of the BERLIN Candle, and the current Heikin Ashi close as the BERLIN Candle close, while setting hard limits for BERLIN Candle open and close values so that they can never exceed the high and low of the underlying japanese candlestick.
One problem still persists though. The actual current price data is lost. However, the BERLIN Candles have solved this by adding a fifth part to the candles. The close of the underlying japanese candlesticks are indicated with a plus-sign. This way, actual price data is never lost, while keeping all of the other benefits of this type of candles.
A few added bonuses:
The addition of the 14 period ATR at the latest candle
The baseline from Ichimoku is included as an option
The 14 period ATR value of each candle can be seen in the indicator data as
the orange value

Commander IndicatorCommander Multi Indicator
included:
Pioneer EMA
Commander 3MA with MAs cross signal
Double Ichimoku - Kijun Base-Line (26) and Kijun Commander Moving (103)
Parabolic Sar
Bollinger Band
3-Stroke Movings
