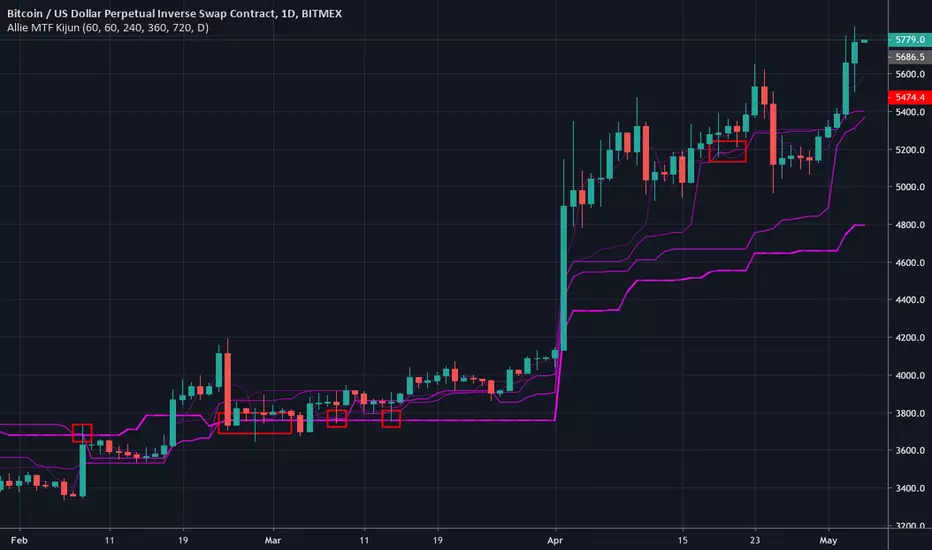
Allie MTF KijunMulti-timeframe kijun. The current timeframe's kijun is represented with dashed line.
Cerca negli script per "ichimoku"


Trend Master CryptoFeatures:
Show price trend very clearly.
Mark entry signals on candles.
Getting Started:
Green candle is time to buy or long.
Red candle is time to sell or short.
Set your stoploss around cloud upper or lower ranges.
Contributing:
You can report bugs or issues under this page.
Any advice would be helpful for improving this indicator's accuracy.
Application:
This is an invite only indicator.

CryptocloudHere's a cloud witn both, original & crypto settings.
I had to make some little tweaks in order to get the cloud accurate.
Works well & has more fun in low timeframes. 3D effect :)

OBV-Ts-Ks [by: Bijan Ajdary]This indicator adds Tenkansen and 3 types of Kijunsen to the OBV chart And making it highly efficient for professional traders.
Written based on the teachings of dear Chris

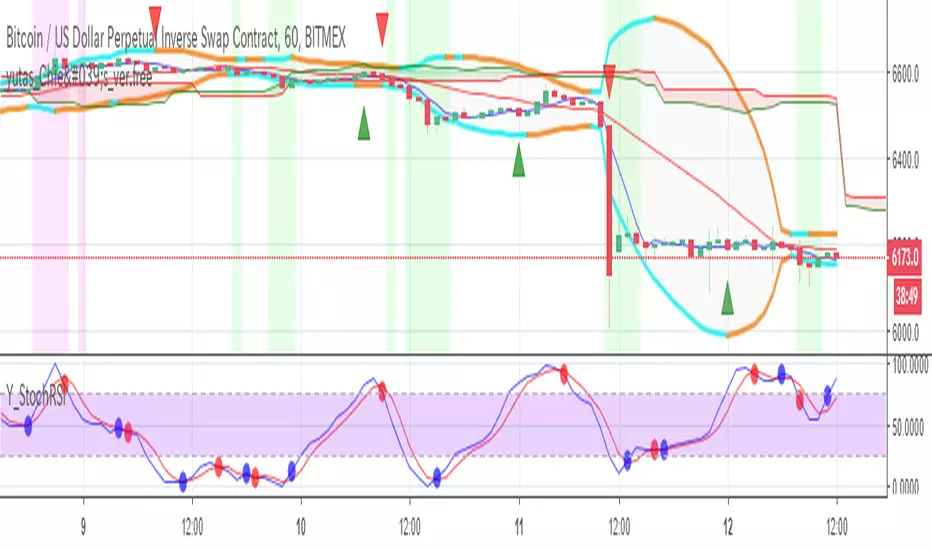
yutas_Chie's Indicator_ver.free
It is a free distribution version of Chie's Indicator.
ちえさんインジケーターの無料配布バージョンです。


TETSU style 2 Black II chobixautoMA3Lines & kumo & ts & tc River TETSU style 2 Black II chobix version


CCS Trading 1.0This is a custom crypto script to be used by CCS. This is a custom crypto script to be used by CCS. This is a custom crypto script to be used by CCS.

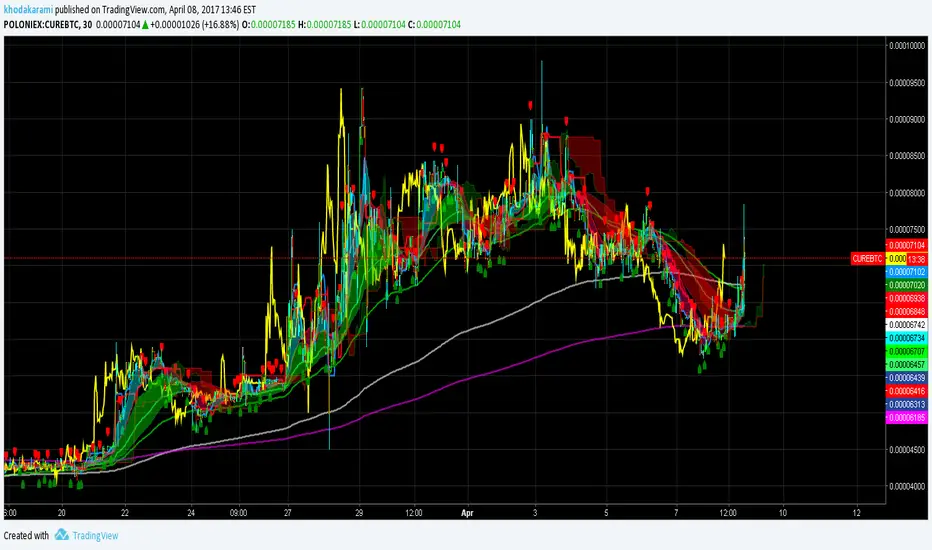
Guerrilla AdvancedThis indicator was designed with people without Pro License in mind (Including many of my close friends).
Basically, you will get a combo of few different tools in one box, with ability to turn them on and off with a single check mark, also, you have total control over the input numbers that was used in calculations if you so want to, for example, sometimes when i see a massive bullish up trend, i reduce the short rally from 12 to 8 even 6 to get faster signal for selling the trend.
So, what will you get in this pack?
1- Ichimoko. Yes, you heard it right, although we have it in the default tools but hey, it will use one indicator slot and if you don't have a pro license, you will use that slot
2- Rally. This is an old yet very powerful system for getting buy or sell signals, basically, you get two lines and for making the life easier i draw a cloud between them. when the trend passes above the cloud and it was bellow it in past, right after the very first candle that gets above the cloud you can put the buy order, and vice versa, the moment a candle body enters the cloud, if you want an aggressive signal, you can sell, if not, you may want to wait to see if the candles drop bellow the cloud or not then decide.
3- Resistance Support Cloud. Most of us always heard about resistance and support "lines" but many of us don't know that, in each trend, the trend line itself is a resistance or support line, and when you are going in a bullish or bearish tunnel, the floor and roof of tunnels are again resistance and supports, using this part of the tool, just like rally, you get a cloud that shows you the resistance / support "zone"
4- William Fractals. To be honest, I got this part of the code from another source available around. Why? looking at those fractal indicators, you can easily eyeball the trend line or existence of a tunnel.
5- Different EMA lines. If you are one of those people that use EMA lines for their trading, have fun with them, there are few different standard ones and even a custom one that you can put your desired number for it.
Ichimoku_on_steroids v 1.0 (Scalper's) INSame as overlay version, as an indicator.
Use with caution.

Ichimoku_on_steroids v 1.0 INSame as the overlay version, without the leading / price lines, as an indicator.


BaseLine Combo ( Sina Asghary )Ichimoku cloud is one of the most used indicator among professional traders and market participants. My favorite part of ichimoku is the base line, because it signals a good support and resistance level that can be used in market analysis.
This indicator plots the base line in 6 timeframes: 1 DAY, 4 HOUR, 2 HOUR, 1 HOUR, 30 MINUTES and 15 MINUTES
It works really well when you are trading in lower timeframes like 30 MINUTES, 15 MINUTES, 5 MINUTES and 3 MINUTES
As you might realize in the picture, the lines are sorted by thickness and color.
The thickest and the darkest one is the 1 DAY timeframe
The thinest and the lightest one is the 15 MINUTE timeframe
You can use this however you like but i like to use it to find support and resistance levels.
The higher timeframe lines have stronger support and resistance levels

Ichimoku Trading Signals 1Swing Trading (Strategy 1, H4+ timeframes)
Use the Kumo Cloud to identify the trend: price above a green cloud = uptrend; price below a red cloud = downtrend.
Entry signals occur when price or the Tenkan-sen line crosses the Kijun-sen line, confirmed by Chikou Span momentum.
Exit triggers when price crosses back through the Kijun-sen or when Tenkan-sen crosses back below (for long positions) or above (for short positions).
Place stop-loss orders just beyond the nearest swing low/high candle cluster to manage risk tightly.
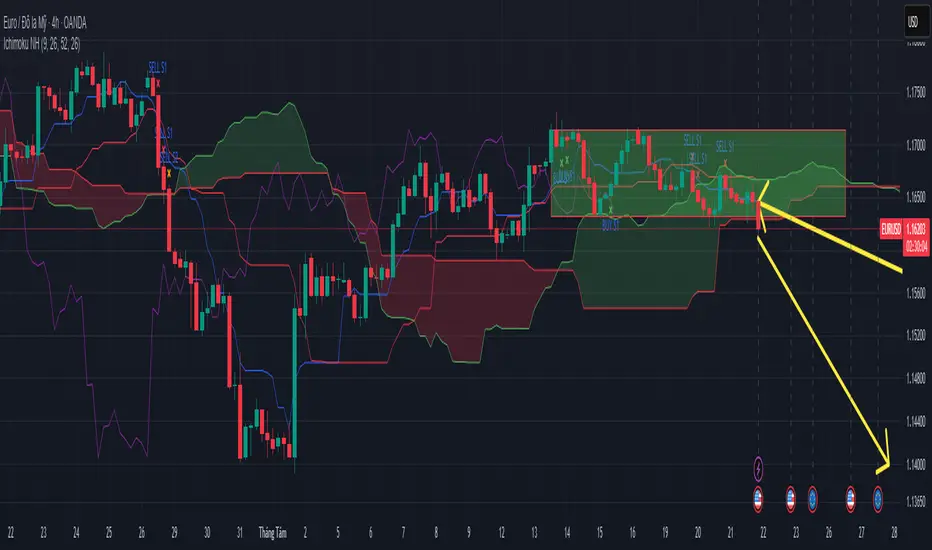
Ichimoku Trading Signals 2Swing Trading (Strategy 1, H4+ timeframes)
Use the Kumo Cloud to identify the trend: price above a green cloud = uptrend; price below a red cloud = downtrend.
Entry signals occur when price or the Tenkan-sen line crosses the Kijun-sen line, confirmed by Chikou Span momentum.
Exit triggers when price crosses back through the Kijun-sen or when Tenkan-sen crosses back below (for long positions) or above (for short positions).
Place stop-loss orders just beyond the nearest swing low/high candle cluster to manage risk tightly.

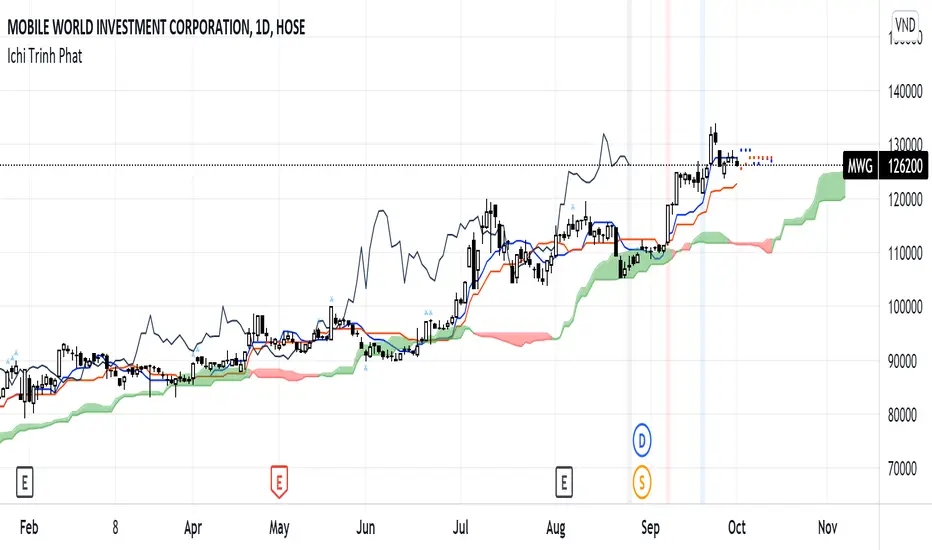
Ichimoku Trinh Phat - By NicolasShow the potential movement of Tenkan & Kijun in the future with assumption that the current highest price and lowest price of their period is unchanged
Show where the Tenkan and Kijun unite that preapre for a potential big movement
Alert for Union Signal, Breakout, Breakdown signal
Background Color Based on EMAHello Traders,
this is a very simple script. It paints the background color based on the close price in reference to an exponential moving average.
If the close is above the EMA the background color will be green.
If the close is under the EMA the background color will be red.
You can adjust colors and the EMA period by yourself.
This little indicator script is just to get a better overview, for example in combination with other indicators.
Hope you guys like this script. Wish you a great trading week.

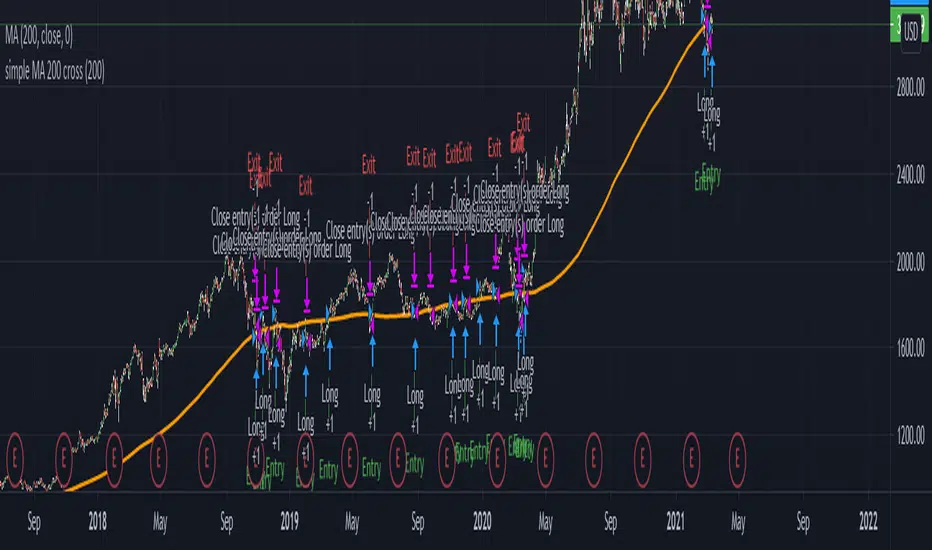
Basic SMA 200 StrategyThe SMA 200 basic strategy will be more than familiar to most traders.
This strategy is to stay with the programming language so to say the "Hello World" of trading.
The SMA 200 basic strategy is also one of the simplest strategies in trading. All that is required is the price and a 200 period moving average. Usually the strategy is used in the daily chart.
The rules are as follows:
Entry: A position is opened when the price crosses the moving average 200 from the bottom to the top.
Exit: The position is closed when the price crosses the moving average from top to bottom.
This is a trend following system and was originally used for trading stocks.
In my opinion, trading with the strategy is recommended to every beginner. There are strategies with better performance, but they are much more complicated to implement. And that's where the big advantage of the strategy can be seen.
Beginners are more than overwhelmed at the beginning of their trading career. Often beginners trade in the 5 min chart with 6 different indicators some signals that they have seen in a Youtube video.
Comparable to a beginner driver who immediately gets into a Porsche as his first car.
Beginners should follow simple rules and avoid intraday charts. Above all, you should do the actual work of a trader.A trader does not just press the mouse twenty times a day and then has easily earned 2000 $. A trader tests systems down to the smallest detail, optimizes and tests again, until he has found an almost " waterproof " trading system. The 200 SMA basic strategy is excellent for gaining experience, learning to follow the rules of a system and not to burn your money right away.
With this script you can test how successful the "simplest strategy in the world" would have been in the past.
Small tip: Do not trade Forex with it it will never work. The strategy is made for long trends and you can find them for example in the stock market.
Have fun with it! About a positive feedback I would be very happy of course.