Cerca negli script per "ichimoku"
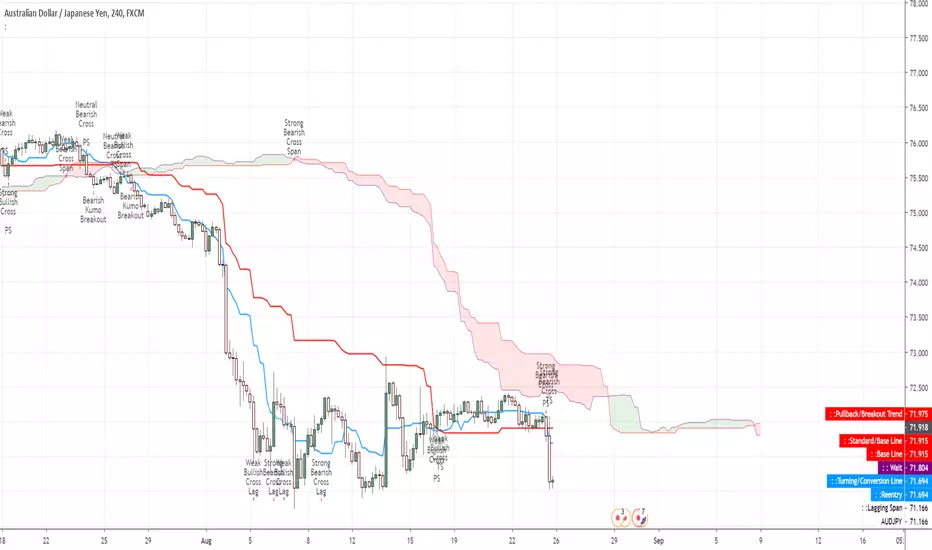
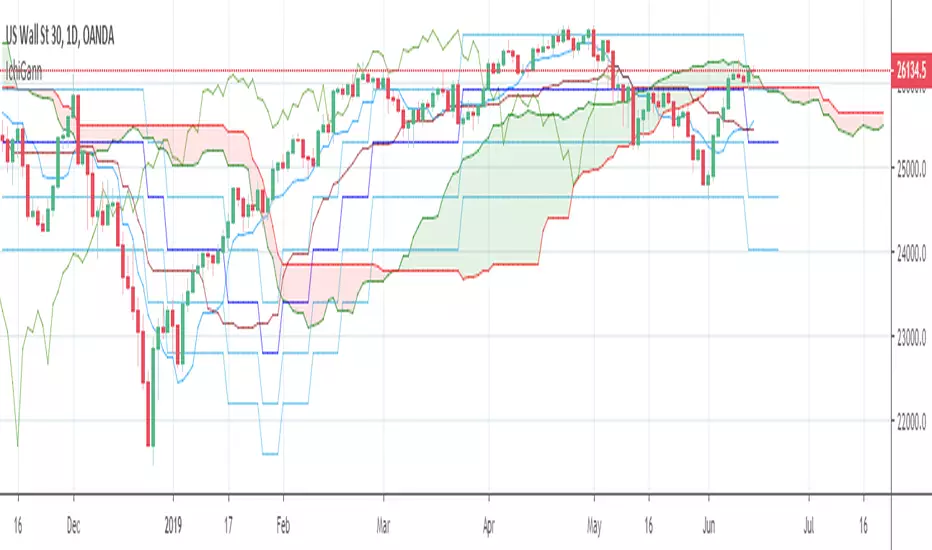
Ichmoku + GannThe script combines Ichimoku Clouds with Gann levels. Kijunsen is used as basis of calculation of 4 Gann levels above and below it. By default Gann Leves at 360 degrees are plotted but one can choose the desired degrees separation.
Multi time frame Ichimoku TK CrossTK Cross indicators across 5 configurable timeframes (+ current timeframe on the top)
Strong tk crosses are the most opaque.
Weak tk crosses are translucent.
Trends are semi-transparent.
Black means tenkan and kijun are overlapping.


Crypto Multi-setting Ichimoku Cloud by MozzarelloEasy way to switch between Traditional, Single, Double and Crypto 24/7 Settings


Price Equilibrium ImbalancesShows the highest/lowest percentage distance that current price has travelled from Ichimoku Lines & potential reversals/pullbacks when price is statistically far out of equilibrium.


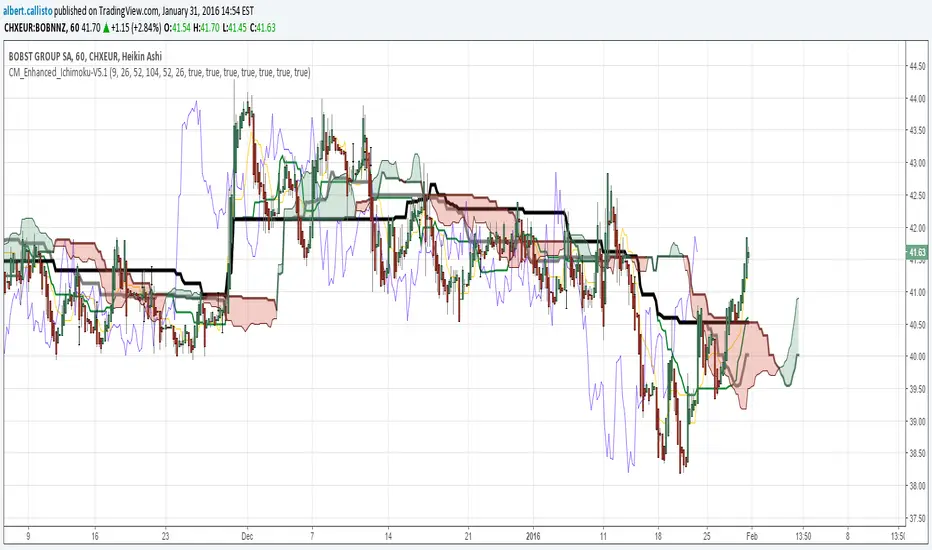
CM_Enhanced_Ichimoku Cloud-V5.1Based upon
Thanks Chris Moody !
Here are my changes, I looked at comments on the original page.
Thinner default lines, changed colors
Added options to add two extra Kijun with their own periods, useful to check resistance/support lines on different scales
Decreased height of arrows
[RS]MTF Ichimoku Cloud V0Request for T_C
The displacement cant be converted (a approximation is possible by calculating the n_bars the time frame occupies by the displacement).

Dashboard trendlines Price(ichimoku14642)Happy new year 2023
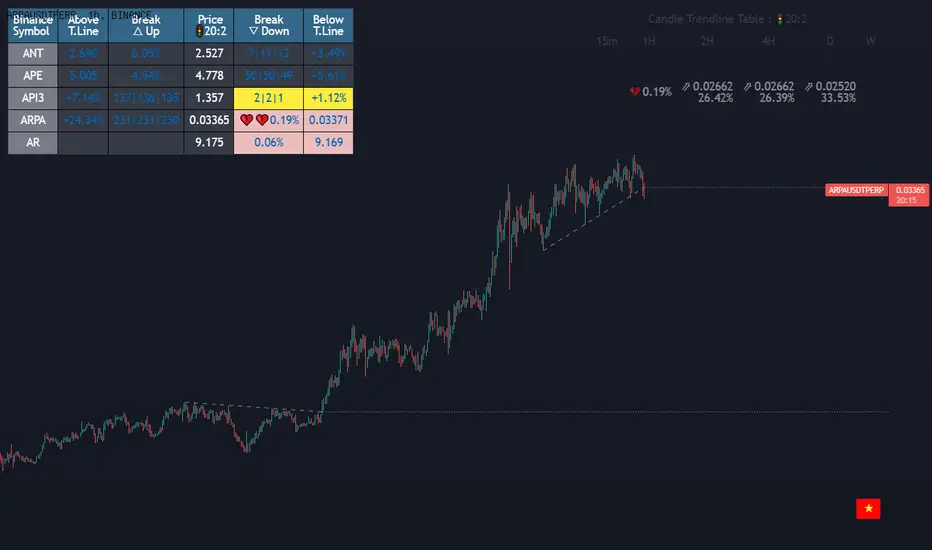
Dedicated to traders, the trendline indicator of 5 trading pairs is automatically listed in this table. Wish success
-on each chart of a trading pair, there is only one trendline pair: 1 uptrendline and 1 downtrendline
-so when the statistics on the table also show the column of the uptrend and the column of the downtrend
-When the price approaches any trendline but the ratio is 1%, that trendline will be colored blue (downtrend), red (uptrend)
-the column above T.line(below T.line) is the value of the current trendline compared to the closing price of the candle
-The Break up (Break down) column when the price breaks will show the green heart (break up), the red heart break (break down) and the percentage value when breaking through the point of the trendline.
-price column is the current price of the candle
-SYMBOL is all taken from Binance in the perpetual contract
-especially when a candle has closed above the trendline (assuming an uptrend), then from the 2nd tree to the current , it will count according to memory so that traders know when the price broke, and how many candles already.
-The breakdown parameter is displayed (for example, 3|8|10), which means that the price has broken through 10 candles, of which 8 trees are closing above the breakout point, and the last 3 are closing above. break point
-In addition, when displaying 3 parameters as above, the next column (above/below T.line) will display the percentage from when the price breaks that point to the current price of the candle.
Thank you everyone for your interest and trust
Đây là script về bảng thống kê đường trendline .
-trên mỗi biểu đồ của cặp giao dịch chỉ tồn tại duy nhất 1 cặp trendline là: 1trendline tăng và 1 trendline giảm
-vì vậy khi thống kê trên bảng cũng hiển thị cột của trend tăng và cột của trend giảm
-khi giá tiến gần đến 1 đường trendline bất kì mà tỉ lệ còn 1% thì đường trendline đó tô màu xanh(trend giảm) ,màu đỏ(trend tăng)
-cột above T.line(below T.line) là giá trị của đường trendline hiện tại so với giá đóng cửa của nến
-cột Break up(Break down) khi giá phá vỡ sẽ thể thiện trái tim xanh(phá vỡ lên),trái tim đỏ vỡ(phá vỡ xuống) và giá trị phần trăm khi phá qua điểm của trendline.
-cột giá là giá hiện tại của nến
-SYMBOL là toàn bộ lấy của sàn Binance trong hợp đồng vĩnh cửu
-đặc biệt khi 1 cây nến đã đóng cửa trên đường trendline(giả sử trend tăng) thì từ cây thứ 2 đến hiện tại nó sẽ đếm theo bộ nhớ để các trader biết được giá đã phá khi nào,và qua bao nhiêu nến rồi.
-thông số khi phá vỡ hiển thị (ví dụ là 3|8|10) thì hiểu là giá đã phá vỡ qua 10 nến, trong đó có 8 cây đóng cửa trên điểm phá vỡ,và 3 cây gần nhất đang đóng cửa trên điểm phá vỡ
-ngoài ra khi hiện 3 thông số như trên thì cột bên cạnh (above/below T.line) sẽ hiển thị được số phần trăm tính từ khi giá phá vỡ điểm đó đến giá hiện tại của cây nến.
Cảm ơn mọi người đã quan tâm và tin dùng
UTG - Unimoku- This Script is based around Ichimoku , it allows you to quick select the different common (and uncommon) Ichi settings that are based around Regulated and Cryptocurrency markets.
- It will push signals/alerts based on data that it is pulling from the chart currently displayed on the screen.
- It will display
- Kumo Twists
- Kumo Crosses
- Visual Indicators based on candle structure inside clouds

Atareum Volume Ichimuku CandleAVIC (Atareum Volume Ichimoku Candles) is clearly an awesome indicator that is based on Ichimoku concepts by combination with volume. This is a new approach of volume candles that is combined with Ichimoku concepts and creates such a powerful tool to trace the market and assists traders to make better decisions, truly.
Concept:
Using Ichimoku leading periods and calculations on redesigning new candles in combination with volume, that makes unique reform candles on Tenkansen movement, but these new candles clearly omit noises in combination with volume, and then the new redesigned system of cloud calculations builds, new series of data for Senko Span A and Senko Span B which is so odd in first view, because they will barely ever cross each other, but they show very more informative and useful.
Parameters:
Section 1 : Candle colour setting for flourishing just as you desire !
Section 2 : Defining Periods of standard Ichimoku and source of candle data in combination with determining the smoothing type of moving averages and signal period.
Section 3 : Select using Heikin Ashi based candles alongside with redesigned cloud calculation type and three additional moving averages which can plot on each newly generated candles and standard candles on a chart with the type mode defined in the previous section.
Note: if you want to omit any or all of these moving averages, you can use 0 in period, instead of selecting "None" in the plot moving option!
Usage :
Overall:
Regardless of the additional moving averages which will lead to so many situations of market according to their types and designs, that is four different period for new redesign AVIC and three period for standard chart. You can easily select periods and type for these moving averages. Also, do not forget that signal moving averages is shown only on AVIC chart and have two different colour for upward and downward trends. Other moving averages are plot by just one single colour.
Cloud levels are so important because AVIC candles show respect to them and when they break the clouds upward or downward it's surly beginning of a trend that is may last long. Also when cloud levels flatten, it is determining a support or resistance according to up cloud or down cloud nature and as long as they will continue or repeated periodically on same level of AVIC chart, it will implement their weakness or strength.
Support and Resistance:
Any flattens of cloud up or down level means the support or resistance level due to its nature, but important thing is how long the cloud lasts flatten or how many times repeated in the same level in AVIC chart.
For plotting the support or resistance you should trace first candle of start of flattens in standard chart just like following picture.
Divergence:
All Higher high or Lower low of standard chart has its reflect in AVIC chart but there is secret in it, It is named divergence. When standard chart price candles generating lower low but the AVIC chart candles do not cross the bottom, it means we will spike high as soon as AVIC candle chart complete its divergence. You can see perfect example in following picture.
Cloud level Ends
When cloud down level become flattens and cloud up level start a bull run it means we will face a great up trend movement but as soon as cloud down level starts to move up it mean we are going to finish the bull run and maybe it goes with consolidation phase or reversal phase. This reaction is exactly happen in vice versa for bear run trend. You can see both examples in following pictures.
Note: if we face end of bull run and cloud down level make a U turn shape upside down it means we will have reversal phase even not too long but it is sharp and fast reversal. If cloud down level just turn right slightly, it means we should have consolidation phase, mostly or we can continue the last trend slightly. All these situations can happen in vice versa bear run. You can see example in following picture.
Signals:
Long but risky:
You can go long when AVIC candles are green and be in position as long as they are not change in colour.
Long and safe :
You can go long when AVIC candles cross up cloud down level and be in position as long as AVIC candles cross down cloud up level.
Long and sure:
You can go long when AVIC candles cross up cloud up level and be in position as long as AVIC candles cross down cloud down level.
Short but risky:
You can go short when AVIC candles are red and be in position as long as they are not change in colour.
Short and safe :
You can go short when AVIC candles cross down cloud up level and be in position as long as AVIC candles cross up cloud down level.
Short and sure:
You can go short when AVIC candles cross down cloud down level and be in position as long as AVIC candles cross up cloud up level.
Notice : Candles with large body are so strong but if a body candle is weak or flatten it may a signal of changing colour and direction, especially when using Heikin Ashi type.
It is the result of many years of experience in markets and there are so many details about this AVIC chart which I am in the experiment phase to publish in the future, so please help me with your ideas and do not hesitate to comment and inform me any suggestions or criticism.

Kurotoga CloudKurutoga Cloud is a cousin-inpired cloud of the Ichimoku Kinko Hyo.
It removes the unnecessary fluff and just focus drawing the 50% levels on current mainframe for the typical RSI standard length (14) settings on current time-frame (Lead A) and the Higher time-frame (Lead B)
User should pay particular attention to where the cloud will draw longer straight-lines. Those ranges are 50% ranges of significance and likely to act as target zones for support/resistances in the future.
The cloud can also act a a very reliable trend indicator.
Intraday = D
D = W
W = M
M = 4M

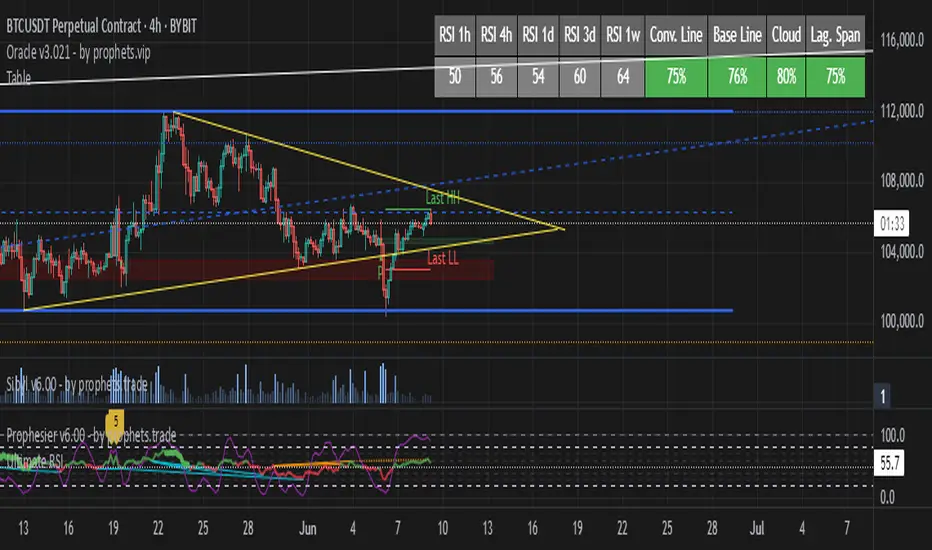
TableRSI and Ichimoku Strength Table
This indicator displays whole-number RSI values (1h, 4h, 1d, 3d, 1w) and Ichimoku strengths (Conversion Line, Base Line, Cloud, Lagging Span) in a customizable table. Toggle between horizontal (9x2) or vertical (2x10) layouts, with adjustable position (e.g., Top Right), text size (Tiny to Large), and colors (border, header, text, RSI: >70 red, <30 green, 30-70 yellow; Ichimoku: >50 green, <50 red). Ichimoku components are plotted on the chart. It offers a clear view of momentum and trend strength for traders.
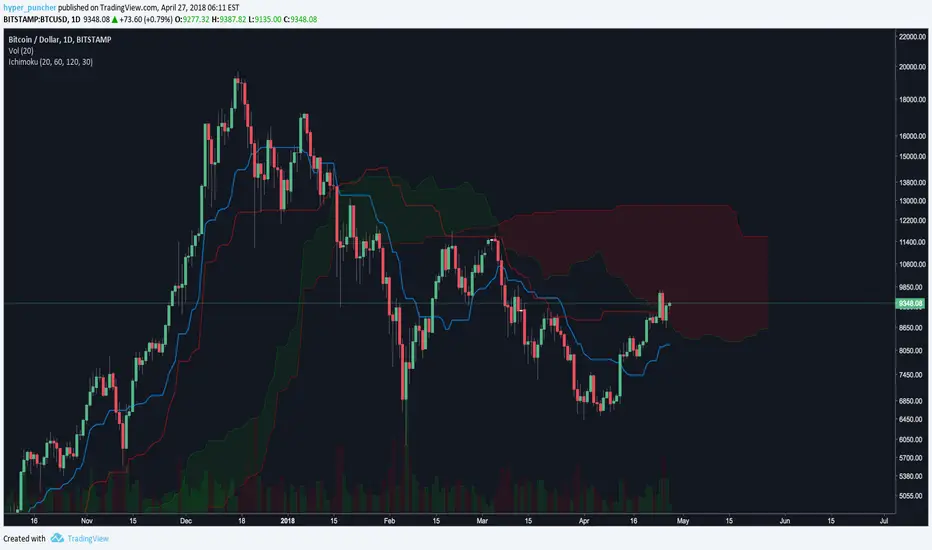
IchiAlerts StudyIchimoku Alerts is an indicator born from the Ichimoku Cloud .
The Ichimoku Cloud is a collection of technical indicators that show support and resistance levels, as well as momentum and trend direction. It does this by taking multiple averages and plotting them on the chart. It also uses these figures to compute a cloud which attempts to forecast where the price may find support or resistance in the future.
We have combined several key elements of the Ichimoku Cloud to produce our unique Ichimoku Alerts indicator.
There is also a strategy version so you can backtest results if you so wish to, which I will also share on TradingView.
This indicator can be automated and adapted to fit other timeframes (I've managed to create a nice bot on the 5M timeframe with specific Ichimoku settings).
The Indicator will also print exit signals when the conversion line (blue line in the image) crossed the base line (white line in the image).
If these blue and white lines were to cross again while all other conditions of this indicator are still being met, it will fire a secondary long/short signal. The image above provides a perfect example of a primary short signal, followed by an exit signal, followed by a secondary short signal. In this instance, both signals were winning trades.
Settings within the study contain exactly the same settings you'd find in the standard Ichimoku cloud ...
- Recommended settings for Crypto are 20-60-120-30
When framing a trade after receiving a signal, you should....
- place your stop loss a the lowest cloud line (for longs) or the highest cloud line (for shorts). See image above for a short example
- Your Take profit target is yours to decide, but taking proper risk management is key, and I would advise to aim for a risk/reward ratio of 1:1.5
Hopefully I have covered the basics of this indicator. It's simple yet very effective at providing signals of changes in trend, and with the added bonus of being able to alert those changes, means you don't have to check multiple charts every hour or so!

Ichimoku + RSI + MACD Strategy1. Relative Strength Index (RSI)
Overview:
The Relative Strength Index (RSI) is a momentum oscillator that measures the speed and change of price movements. It ranges from 0 to 100 and is typically used to identify overbought or oversold conditions in a market.
How to Use with Ichimoku:
Long Entry: Look for RSI to be above 30 (indicating it is not oversold) when the price is above the Ichimoku Cloud.
Short Entry: Look for RSI to be below 70 (indicating it is not overbought) when the price is below the Ichimoku Cloud.
2. Moving Average Convergence Divergence (MACD)
Overview:
The MACD is a trend-following momentum indicator that shows the relationship between two moving averages of a security’s price. It consists of the MACD line, signal line, and histogram.
How to Use with Ichimoku:
Long Entry: Enter a long position when the MACD line crosses above the signal line while the price is above the Ichimoku Cloud.
Short Entry: Enter a short position when the MACD line crosses below the signal line while the price is below the Ichimoku Cloud.
Combined Strategy Example
Here’s a brief outline of how to structure a trading strategy using Ichimoku, RSI, and MACD:
Long Entry Conditions:
Price is above the Ichimoku Cloud.
RSI is above 30.
MACD line crosses above the signal line.
Short Entry Conditions:
Price is below the Ichimoku Cloud.
RSI is below 70.
MACD line crosses below the signal line.
Exit Conditions:
Exit long when MACD line crosses below the signal line.
Exit short when MACD line crosses above the signal line.
